Evitt Nashed
Dr. Smith
April 4th, 2024
To start this paper, what does data mean to us? In my own words, I would describe data as a set of numbers and stats that can give us context to evaluate. Data analysis can be described as looking at a set of data and examining it. I decided to examine and analyze housing data sets.
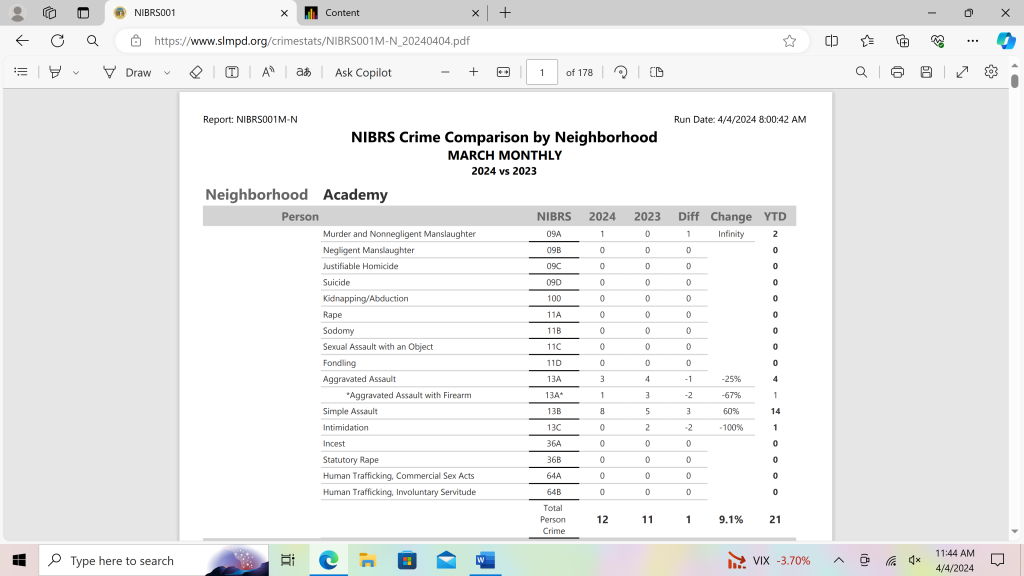
I picked one specifically for Crimes in the St Louis area, especially the neighborhoods. The department that oversees Crimes and publishes them in records would be the Police Department. Some sources that this data set provides would be the Bureau of Justice Statistics, individual crimes published each Month of each year. The police department created these data files to help others be aware of the individual crimes happening in St Louis City. We can use these data sets to better these crimes and to lessen them in the city. These data sets can also be used to see what these numbers mean and how they compare to the past years.

Looking at the data itself is constructed into columns of the crimes itself, the NIBRS, the years 2023 and 2024 comparing them, the change if there is any, and lastly the YTD. The organization of this data is very set and structured so it is easy to understand. It can be used to publish a line or bar graph of the increase and decrease of specific crimes in St Louis.
Cleaning Data can have positive and negative impacts on data sets. The positive impact cleaning data can have would be that it can help you make sure there’s no inaccurate information that can be misused. The negative impact cleaning data can cause would be that it is tweaking the “raw data.” Raw data is beneficial since you can make up anything from that and work on it. Cleaning data was used by the Police Department so the public could have accurate and updated information about crimes in St Louis.
While looking over these data sets, I was considering what the Police department’s goal was for publishing this data. I feel as if they made these data sets for the public to be aware of the increase or decrease of crimes happening in their nearby neighborhoods. They also published this because it can show how the Police in St Louis are helping in committing crimes. The department wanted to publish every year of crimes from 2021 to 2024 for the public to see the different amounts of crimes that were committed by civilians.
The way I would use this data to examine would be copying and pasting the data records and making it into a bar graph to see the increase and decrease of the crimes throughout the years. This data can help surrounding neighborhoods be aware of the crimes that are happening within their community. They could make a change in their community and help in making these crimes decrease. The community has to work together to flourish peacefully and have fewer crimes.