Author: enashed (Page 1 of 2)
Evitt Nashed
I feel as if this first semester flew by! Having Codes once a week is pretty different than having it three times a week since it is a lot longer. In the beginning of the semester, I didn’t find any benefit from the jigsaws, or reflections but later on I now realize this is all helping me achieve my science communication. Having a science class is pretty different because the last time I had one was in high school. Science has always been my weakest subjects, but Dr. Aranda does an amazing job on teaching us these lectures.
1st goal- Global Learning (25%)
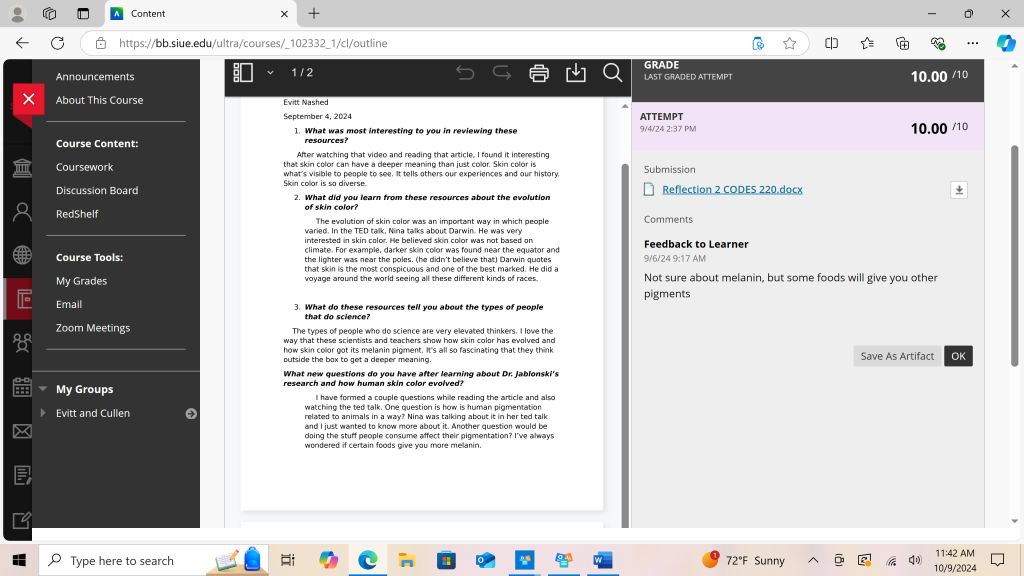
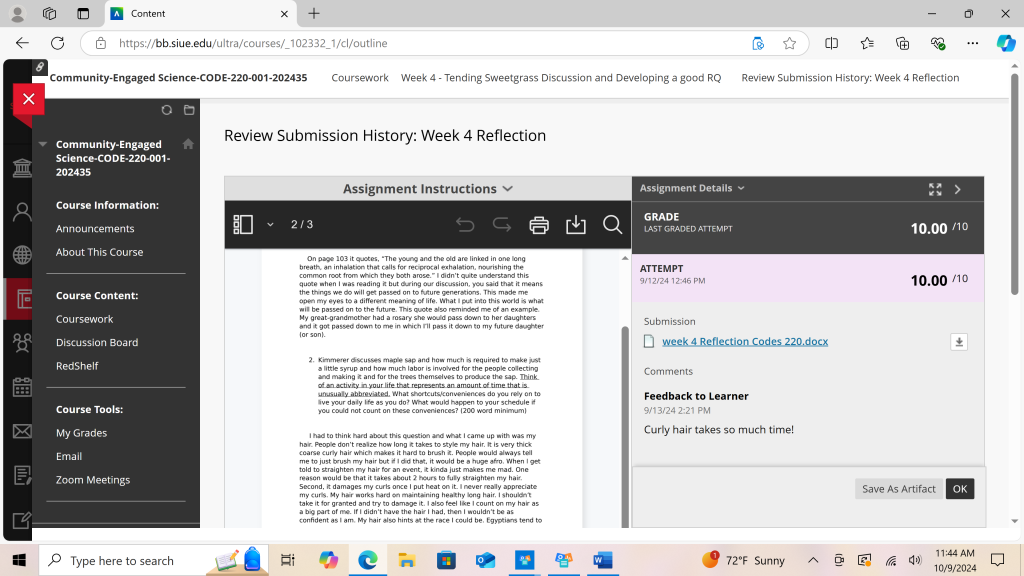
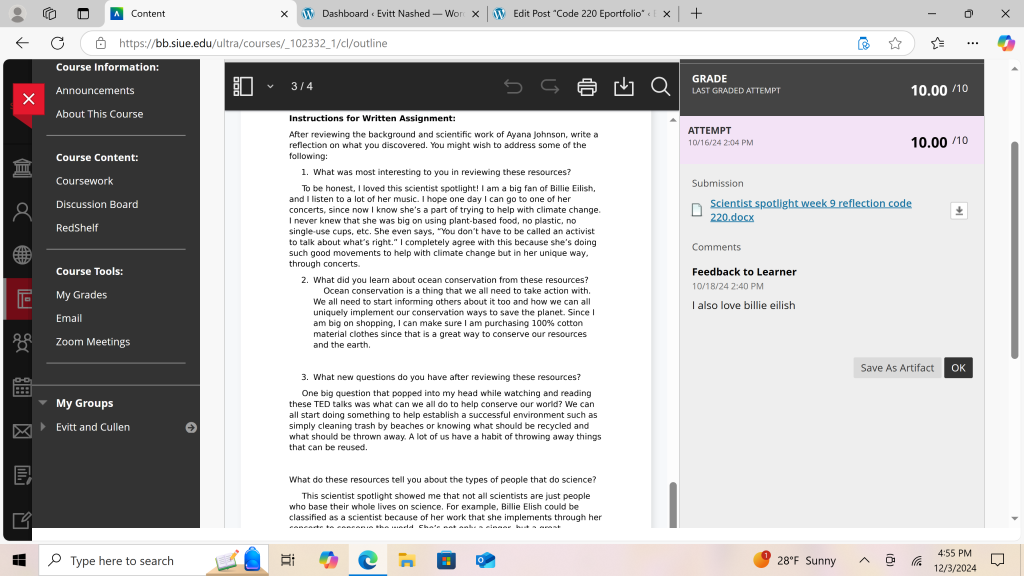
All these reflections give insights on how I am learning about global issues. The first screenshot shows me learning about evolution of skin color. The second screenshot shows me analyzing a chapter in braiding sweetgrass and applying it to my life. The third screenshot shows what I’ve learned about Billie Eilish and her climate change actions.
2nd Goal- Information Literacy (25%)
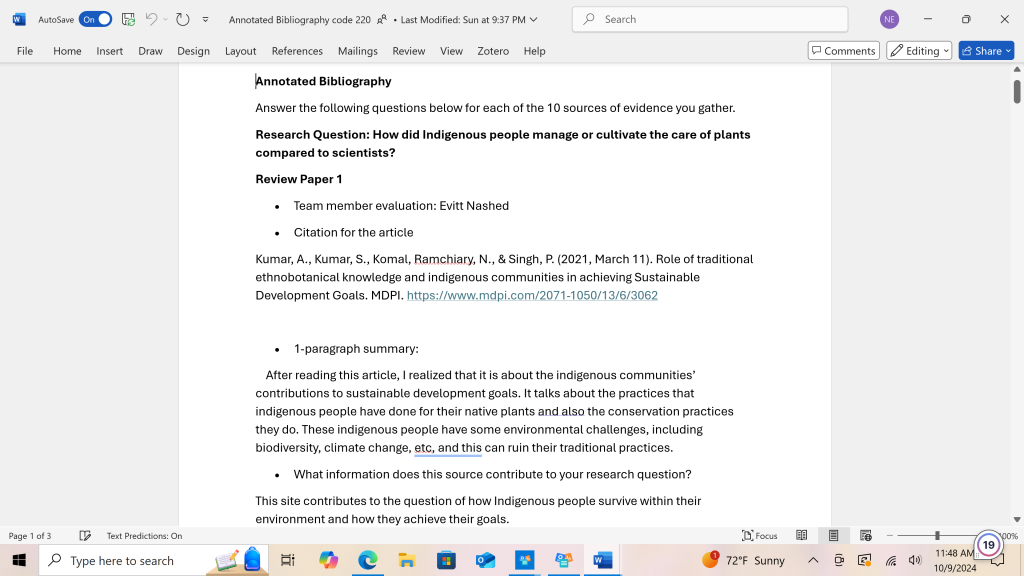
This screenshot shows my partner and I forming a research question for our project and identifying 10 articles.
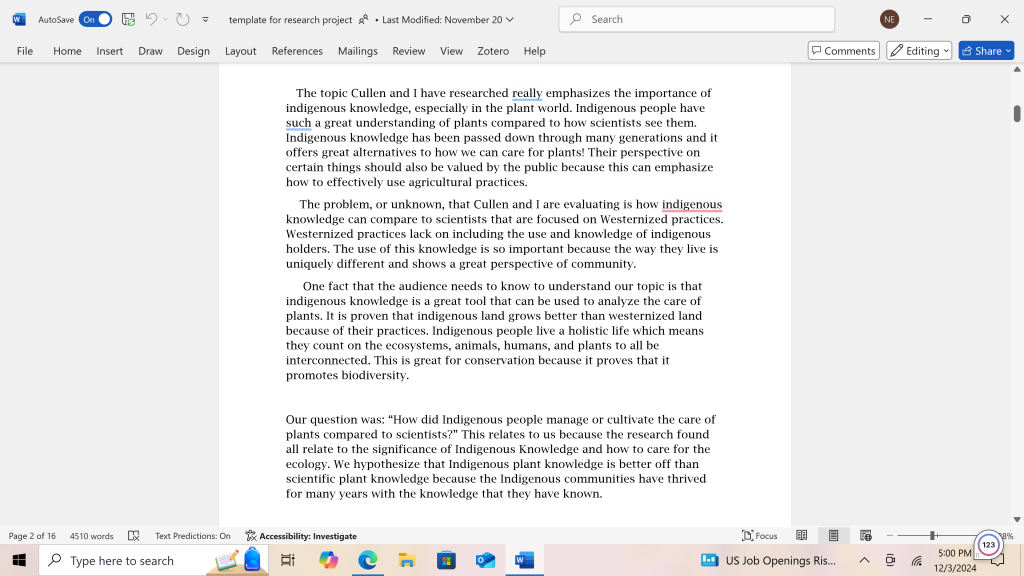
This screenshot shows the introduction of Cullen and I’s research. The introduction is to give some information about the reason on why we picked this topic and what we would like to figure out overall. This introduction also gives some facts about indigenous knowledge.
3rd Goal- Problem Solving (25%)
My first unit exam shows proof of me problem solving with certain scientific questions about the jigsaws and also about how to form a scientific question. this first exam gives me a good idea on how I can better my performance for the next final one.
4th goal- Quantitative research (25%)
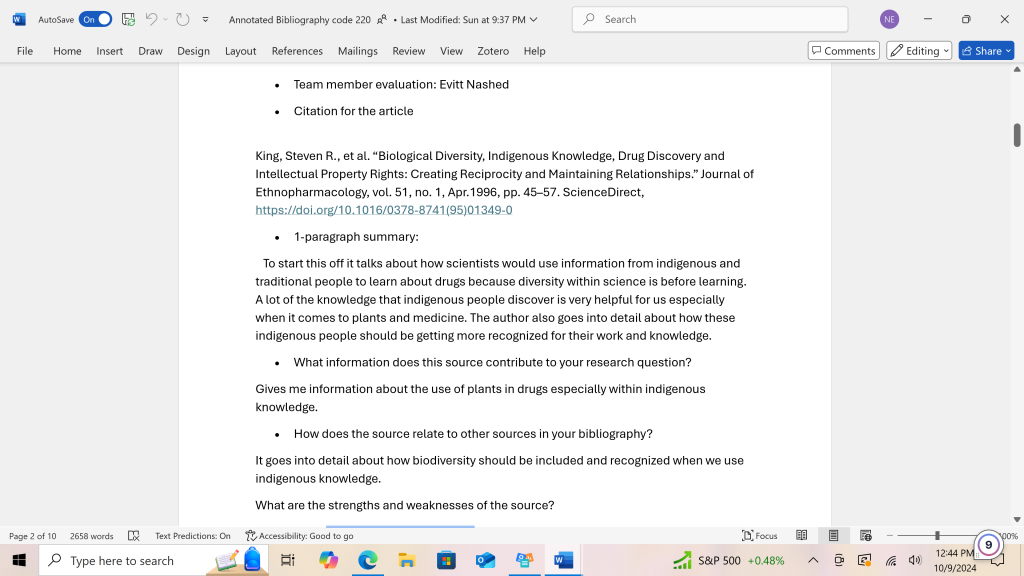
This screenshot shows the proof of my partner and I working on our research report.
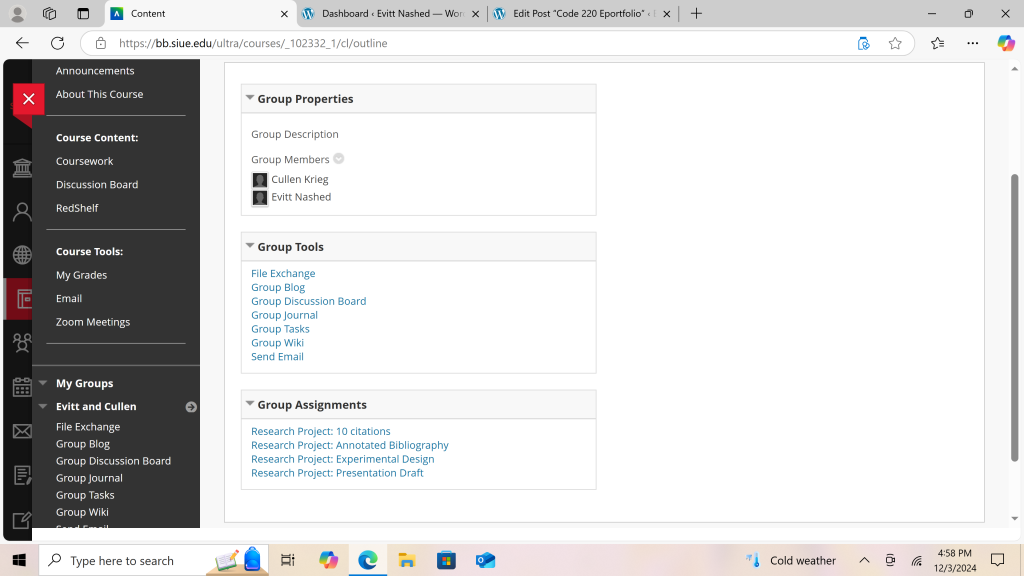
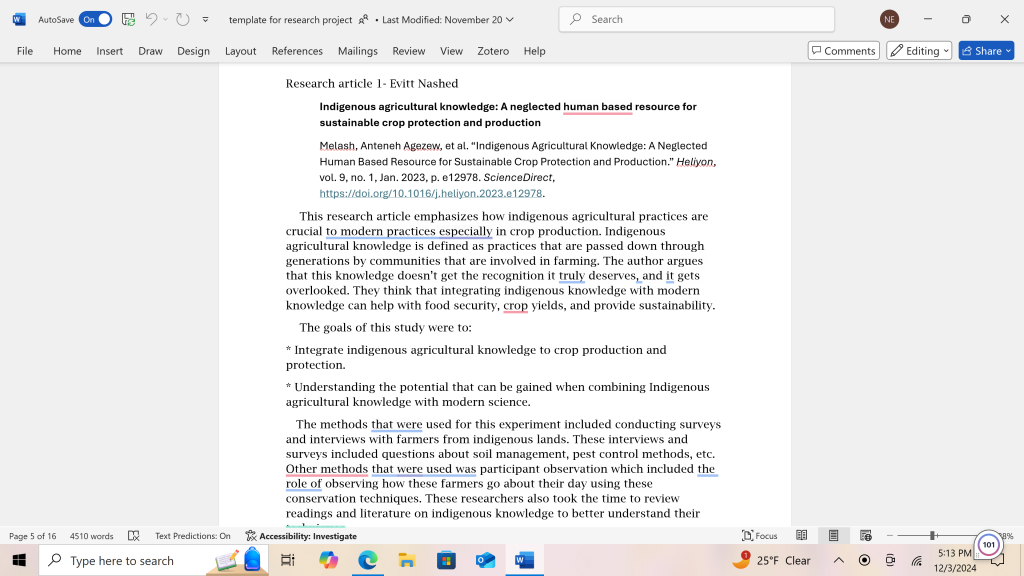
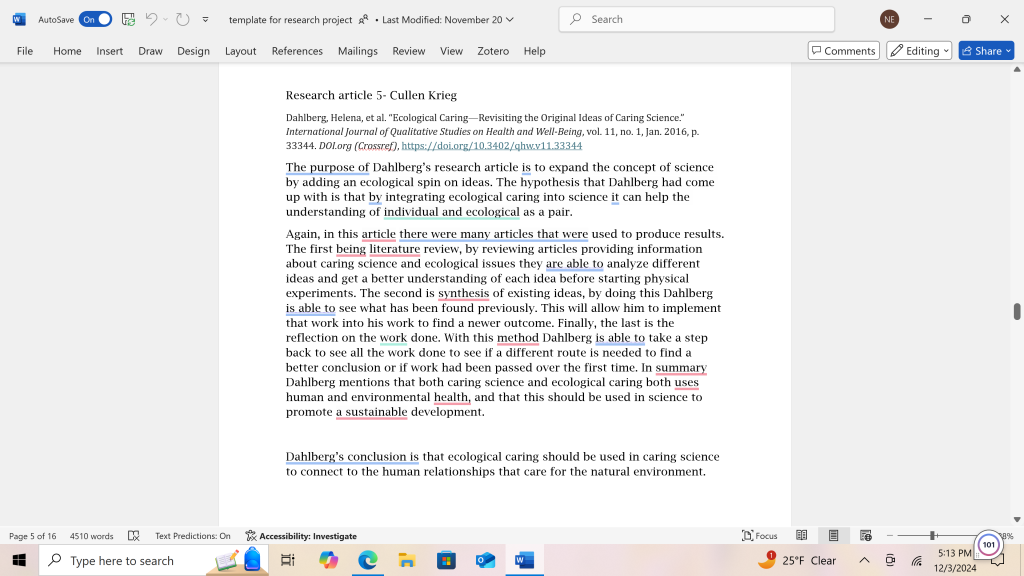
These three screenshots show the work and effort Cullen and I put into our research project.
Being a second-year CODES student has impacted my thoughts and perspectives of things. I’ve started to engage outside my culture and have learned new aspects within it. Being a CODES student also helps me succeed in my major, applied communications. Being able to communicate with the garden members and giving out my perspective really helps me engage with my major. Working with the garden faculty can help me prepare for my future. This is my last semester with Dr. Hildebrandt as my research professor. I would like to thank her for all she has done for CODES and, especially for each individual. She knew how to break down every assignment so we could all understand it. She is by far one of the most beneficial professors I have had.
1st Goal (30%)
Oral Communication- Being able to communicate in a presentable way.
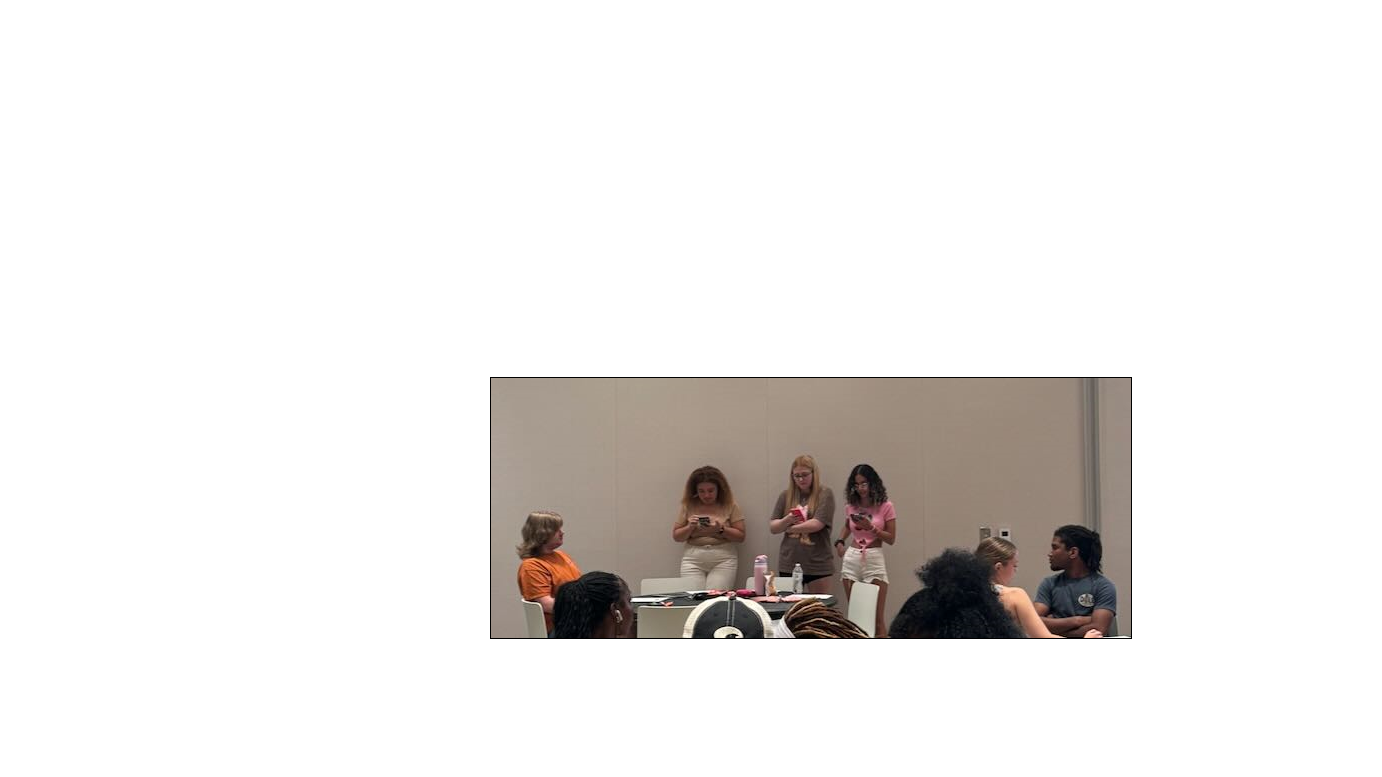
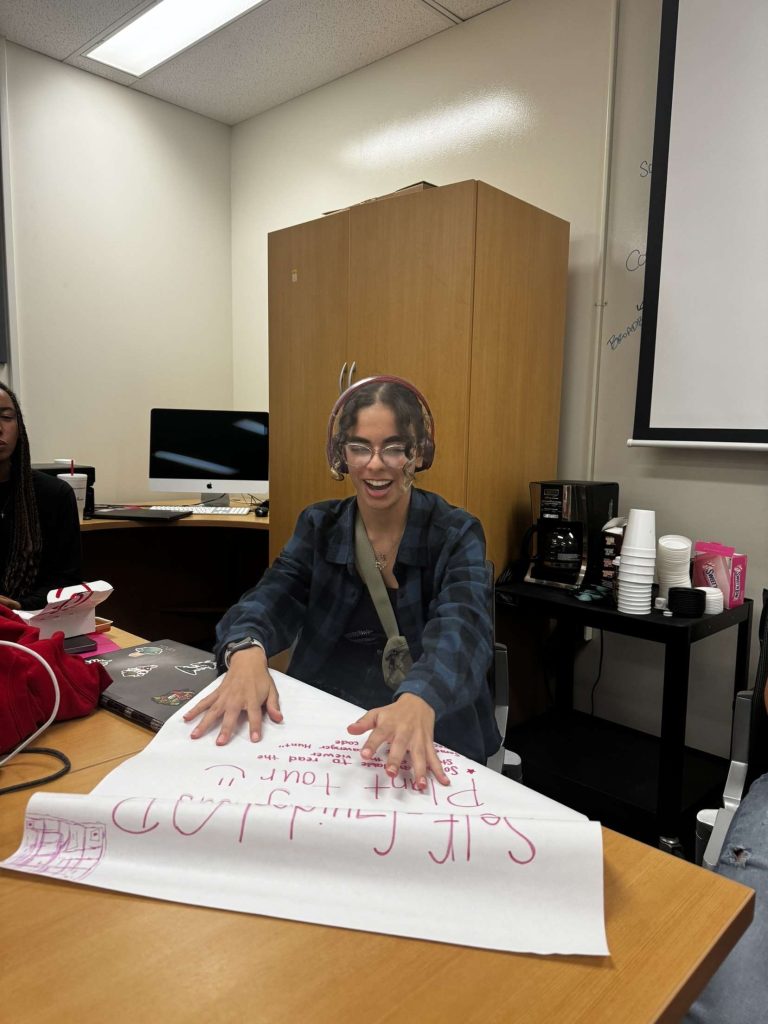
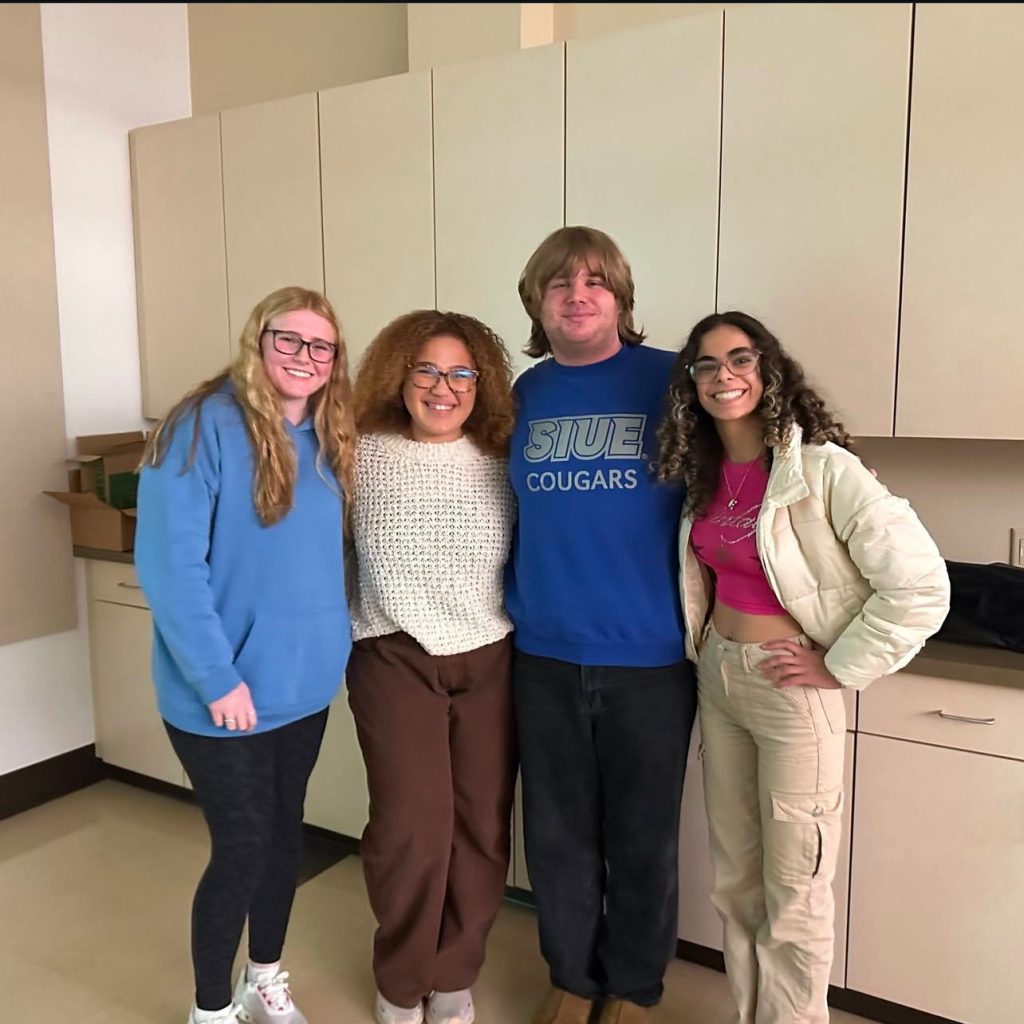
The first three pictures are from earlier this semester and the last picture is from recently.
2nd Goal (20%)
Problem solving- Implements solutions to address multiple contextual factors.
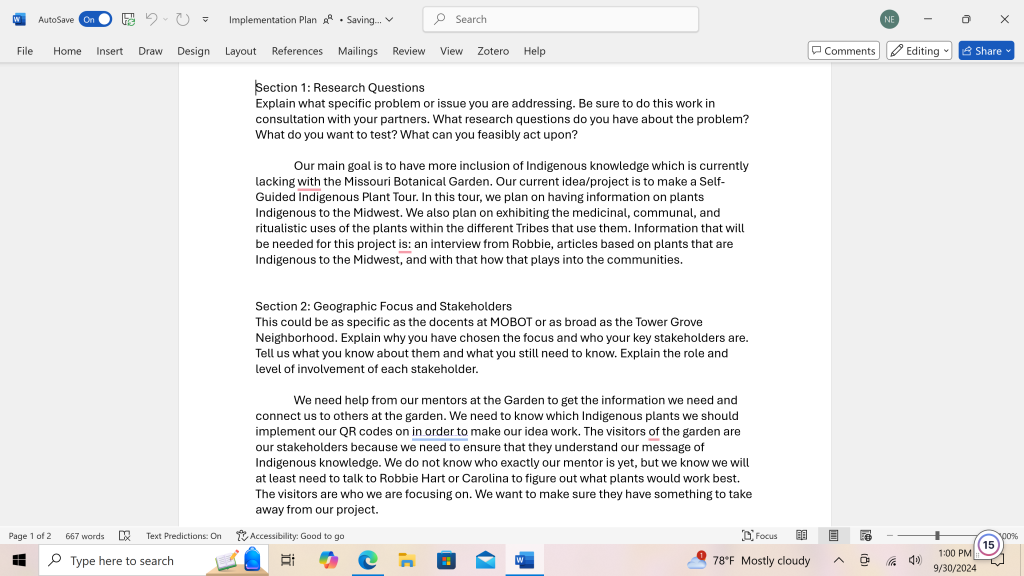
This Screenshot shows the implementation plan my group would like to present to the gardens.
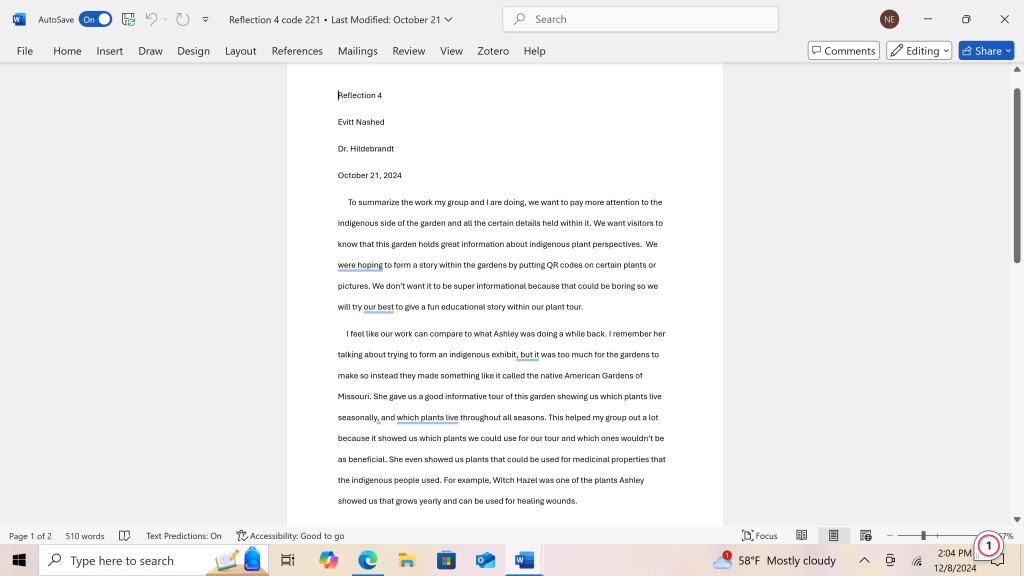
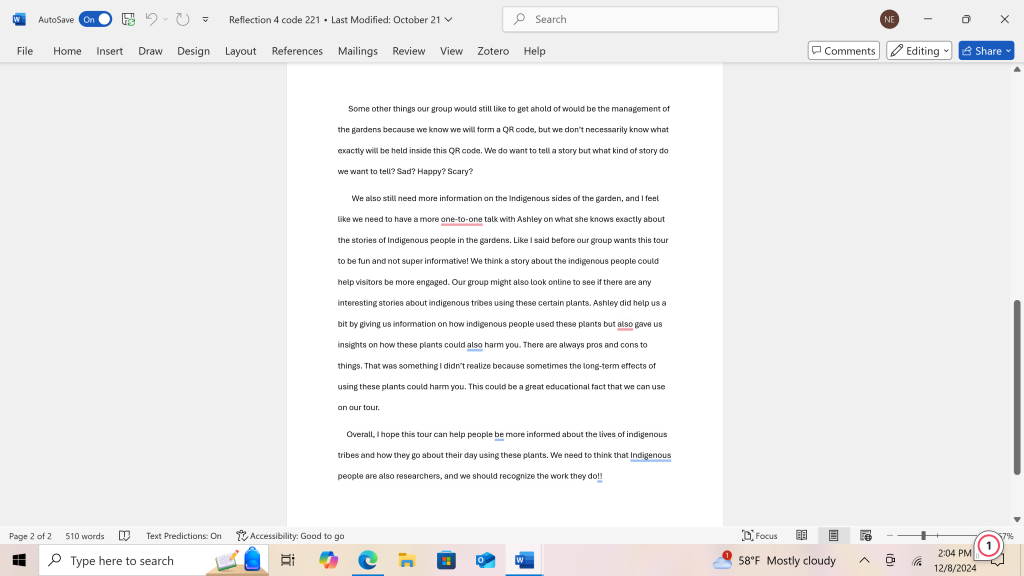
These two screenshots from reflection 4 show the progress our group has made with the input the garden members have given us and what else we need to work on.
3rd goal (20%)
Ethical Reasoning- Recognizing ethical issues in the gardens and trying to resolve them.
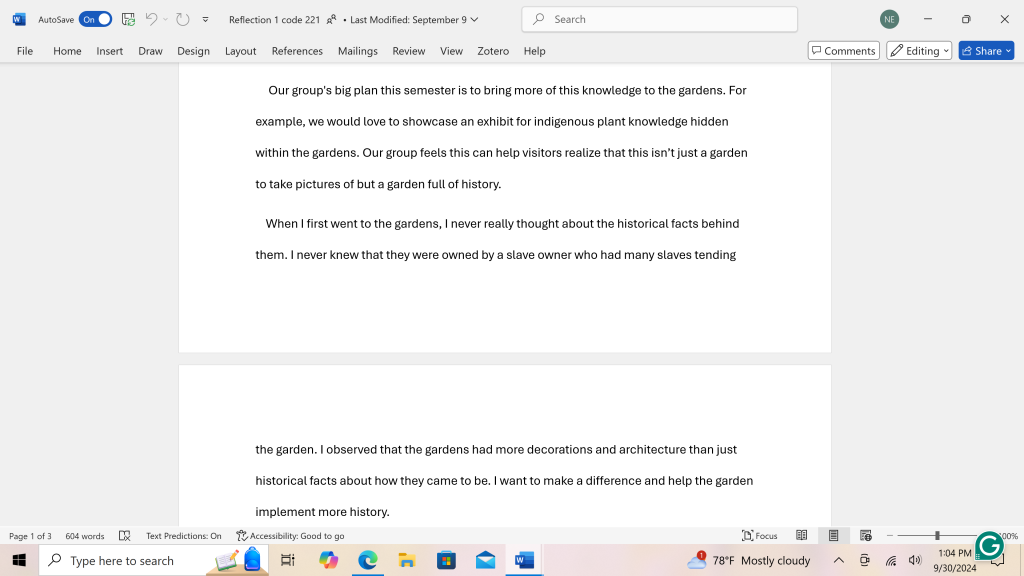

These screenshots are from reflection 1 talking about what ideas we can bring to the garden to better it’s perspective of indigenous knowledge.


Reflection 4 also plays a role in this goal of recognizing some issues we still have with our plan.
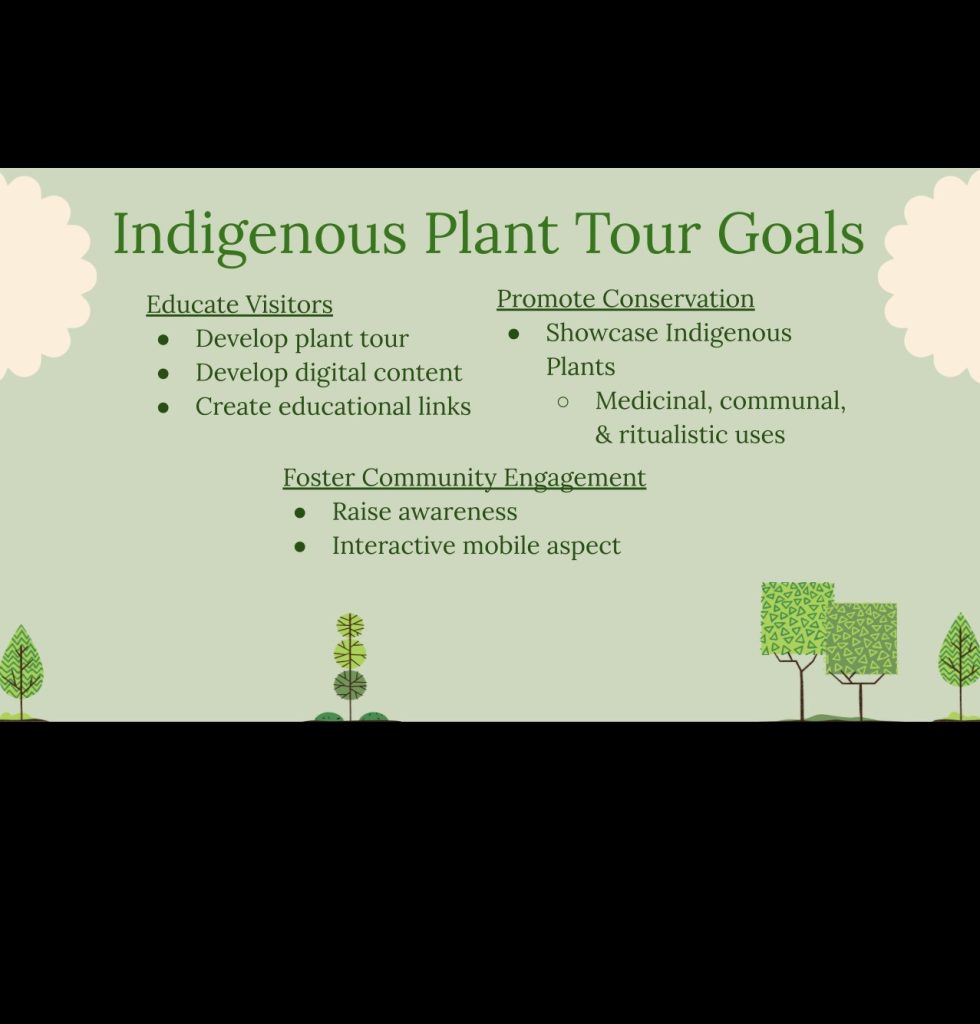
This screenshot shows the implementation plan we will bring to the gardens.
4th goal (10%)
Information Literacy- Defines the scope of research questions effectively and selects information cogently to address them.
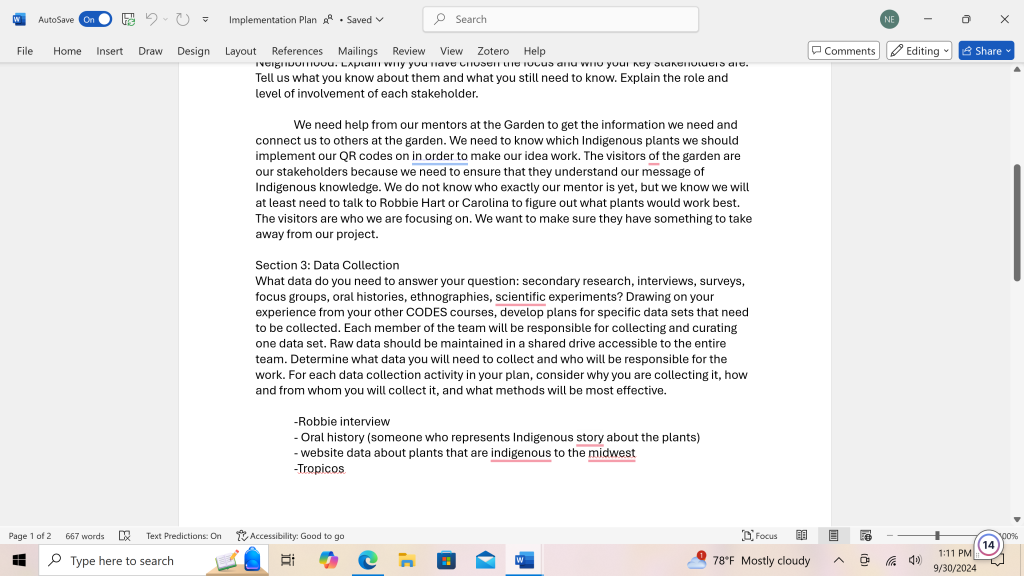
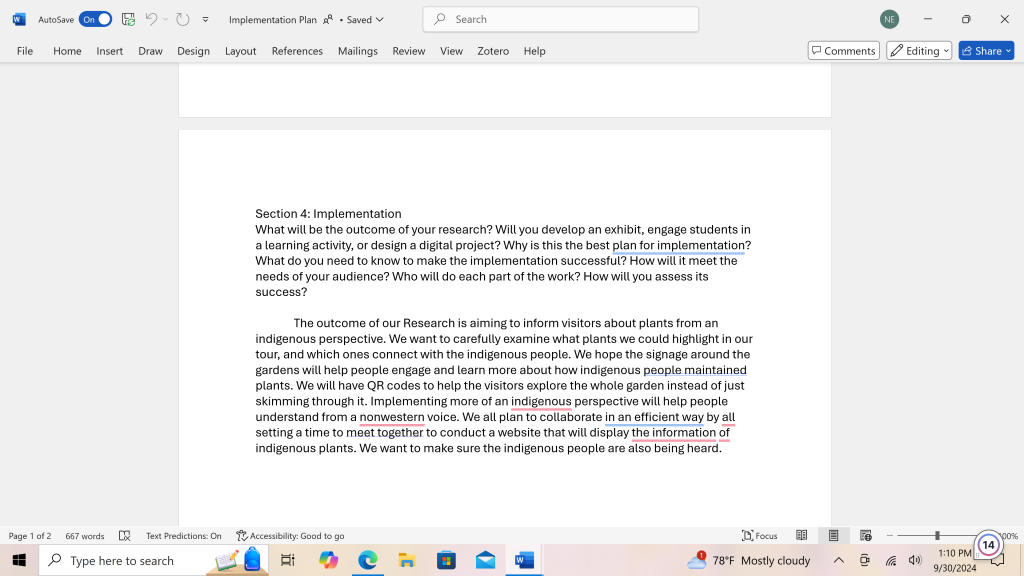
The implementation plan also falls under this category because our group decided to go through the notes we received from our idea and formed a complete plan to conduct at the gardens.
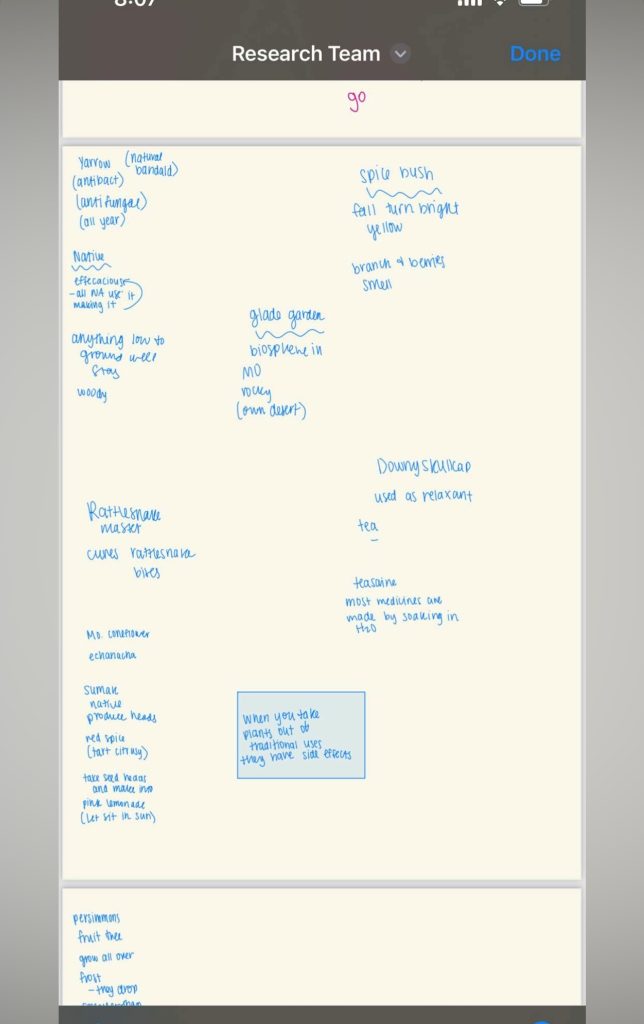
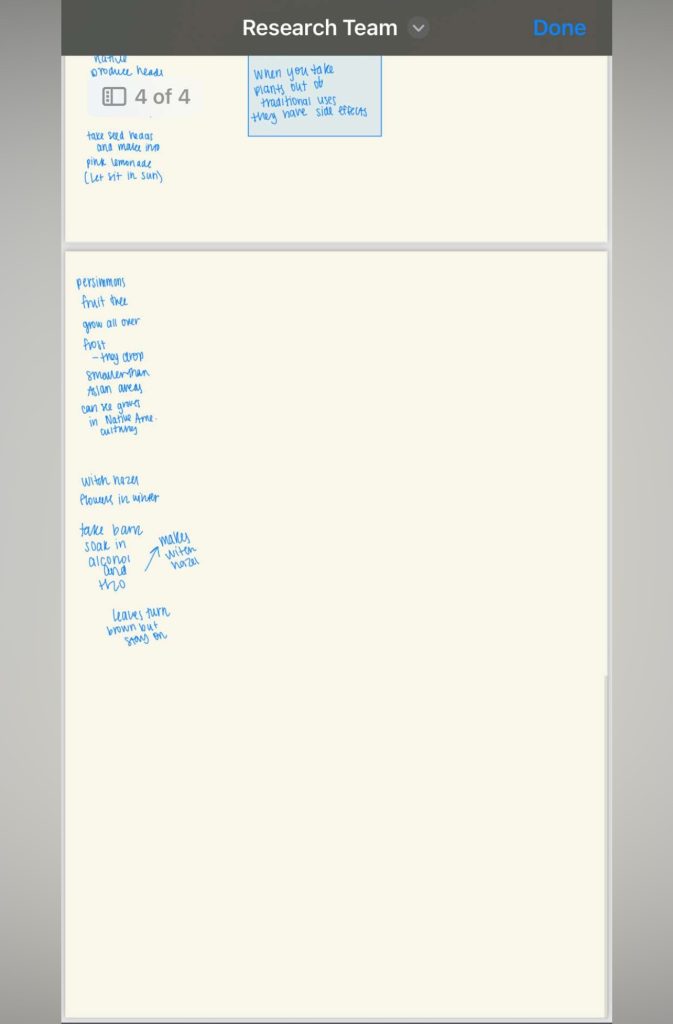
These are notes we took from when Ashley gave us a tour of the native garden and what plants we should use.
5th goal (20%)
Collaboration- Facilitates collaborators’ contributions by building upon their contributions.
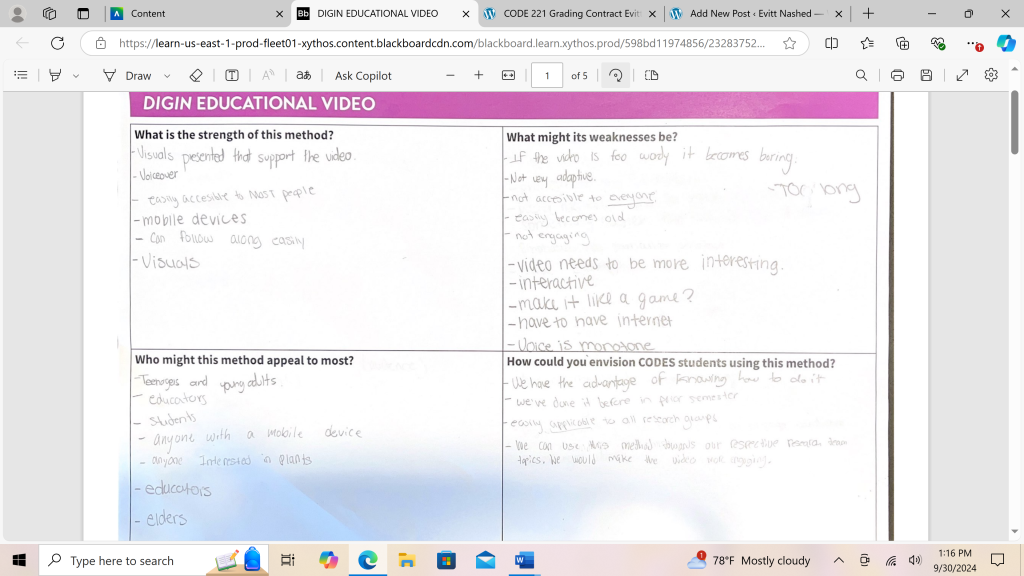
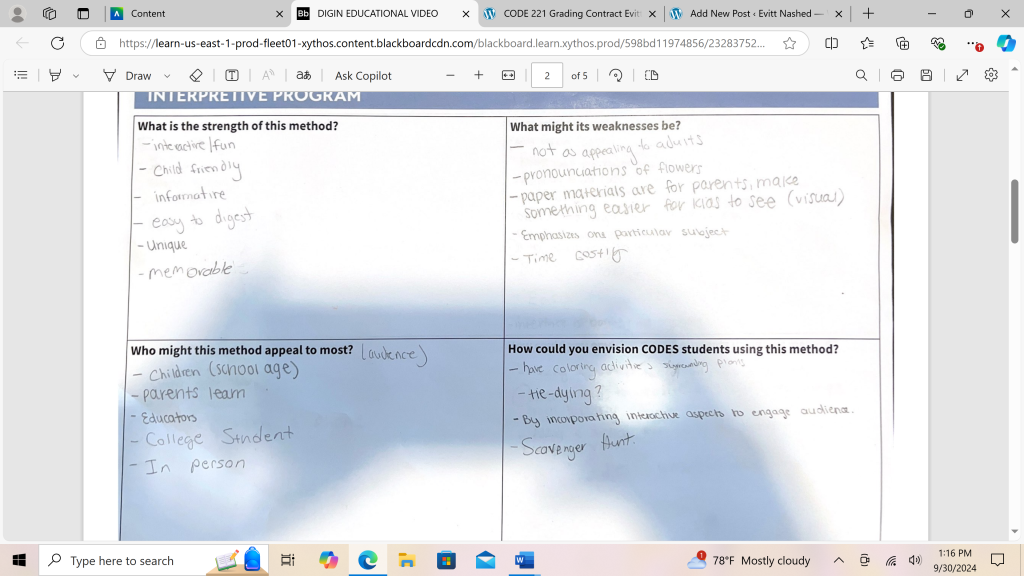
This goal plays a role in giving feedback to the gardens on certain activities, or signages they have posted up and what we think can benefit from it.
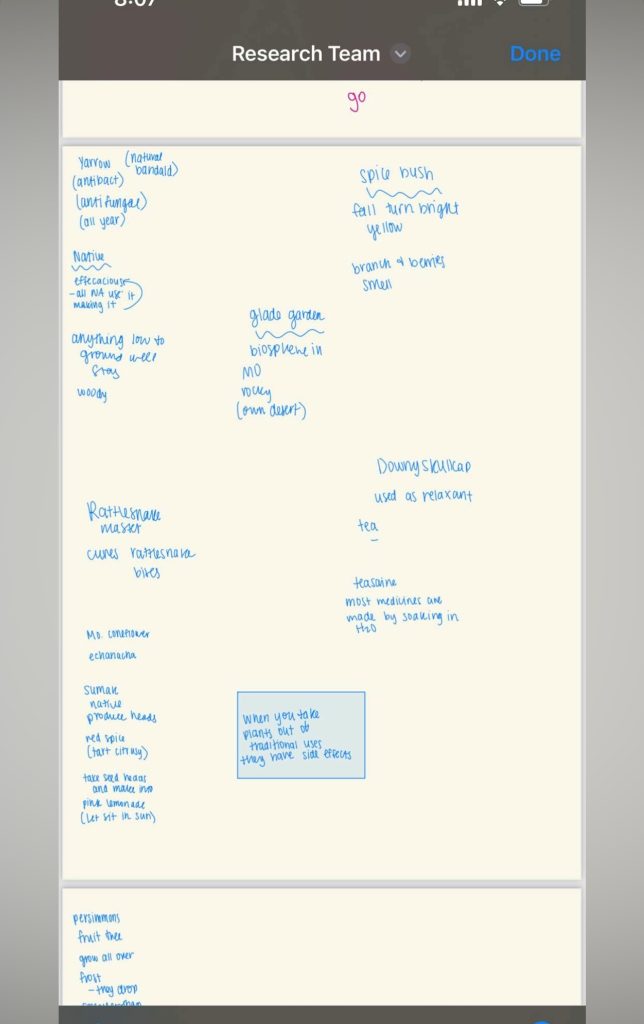
This also plays a role in collaborating with Ashley and giving us input.
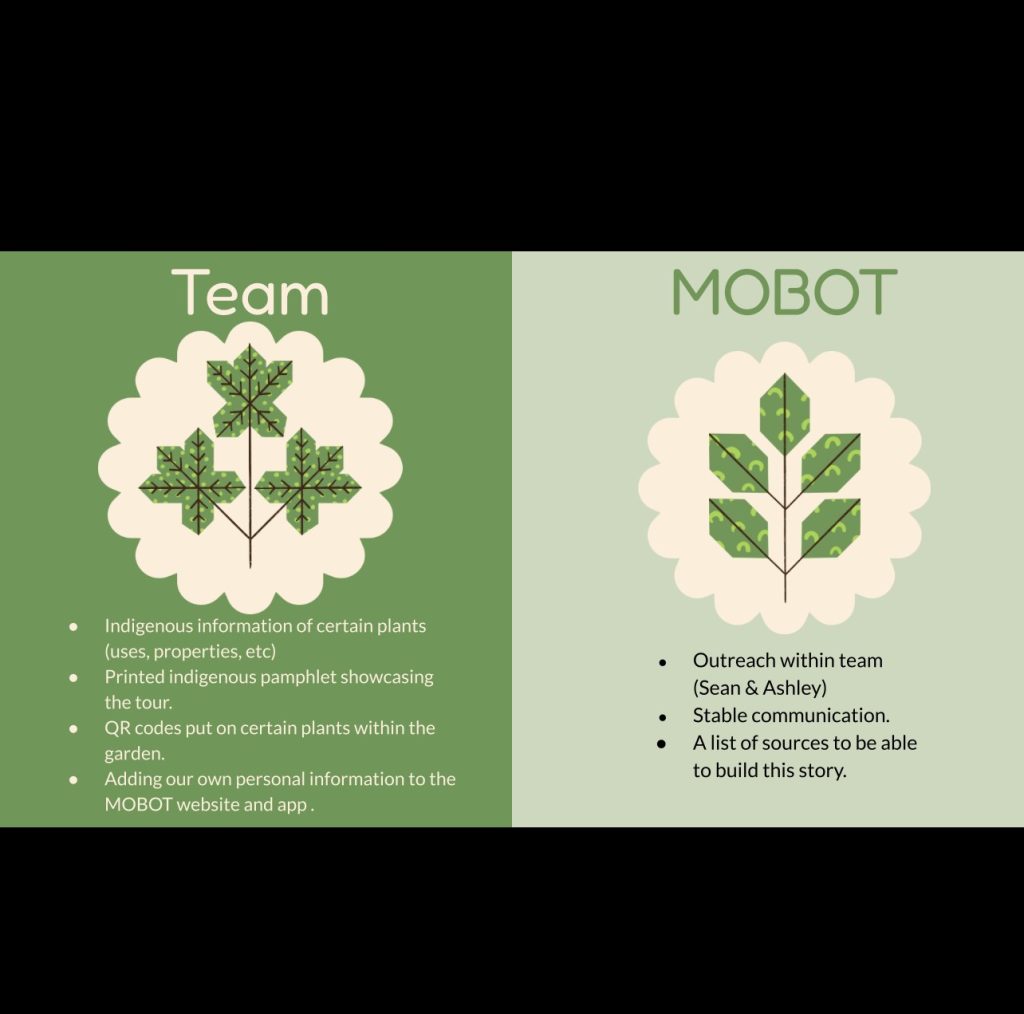
This screenshot is from our implementation presentation, which shows my collaboration.
Student Name: Evitt Nashed
Grade Contracted For __ X_A _____ B ____ C
| What concepts are you going to learn, or skills are you going to develop? | How will you learn the content/ develop the skill? | What evidence will you add to the portfolio to demonstrate your learning? | How will you and I assess the evidence of your learning/skills? |
| (30%) Oral communication 8A-C | Being able to present in a clear formal way without getting hesitant or nervous. | Photos will be interpreted into the portfolio of me being visually active and presenting work to researchers, my partners, teachers, etc. | you will visually see me achieving the goal of putting my thoughts out there and getting over my fear of presenting in front of people. |
| (20%) Problem solving: Implements solutions to address multiple contextual factors. 9C | This semester I will work hard on analyzing information I’ve received to develop a plan that can contribute to the gardens. | My papers and research will consist of change making solutions for certain problems the garden can have and how we can help. | My portfolio will show you the papers and research that will show my certain problem-solving methods I think would be useful for the gardens. |
| (20%) Ethical Reasoning: 3 A-B | Recognizing ethical issues in the garden and trying to resolve them. | Work will be put into my portfolio with how we can better the way the garden can be seen by visitors and how we can tell the garden’s story. | You will actively see the work and effort I put into the research of trying to solve ethical issues that the gardens can improve on for visitors. |
| (10%) Information Literacy: 5A Defines the scope of research questions effectively and selects information cogently to address them. | Identifying questions and answering them in a clear formal way. | My papers will show the question or problem I am trying to answer and implement information that is coherent with my problem. | You will see the work and effort I put into my papers by answering questions with the useful information that is needed. |
| (20%) Collaboration: 12B Facilitates collaborators’ contributions by building upon their contributions. | Working specifically with lab workers and researchers in the gardens and using their information to meet our goals. | Writing notes when I’m meeting with lab workers and using it for our research goals. | You will see the hard work I put into my research with useful information from lab workers or researchers from the gardens. |
Evitt Nashed
Dr. Smith
April 4th, 2024
To start this paper, what does data mean to us? In my own words, I would describe data as a set of numbers and stats that can give us context to evaluate. Data analysis can be described as looking at a set of data and examining it. I decided to examine and analyze housing data sets.
I picked one specifically for Crimes in the St Louis area, especially the neighborhoods. The department that oversees Crimes and publishes them in records would be the Police Department. Some sources that this data set provides would be the Bureau of Justice Statistics, individual crimes published each Month of each year. The police department created these data files to help others be aware of the individual crimes happening in St Louis City. We can use these data sets to better these crimes and to lessen them in the city. These data sets can also be used to see what these numbers mean and how they compare to the past years.
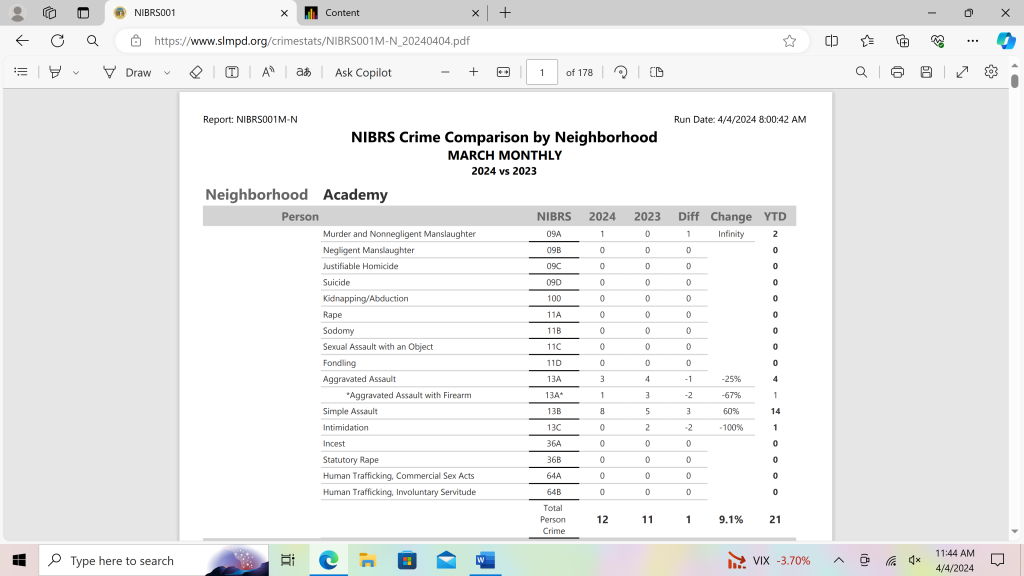
Looking at the data itself is constructed into columns of the crimes itself, the NIBRS, the years 2023 and 2024 comparing them, the change if there is any, and lastly the YTD. The organization of this data is very set and structured so it is easy to understand. It can be used to publish a line or bar graph of the increase and decrease of specific crimes in St Louis.
Cleaning Data can have positive and negative impacts on data sets. The positive impact cleaning data can have would be that it can help you make sure there’s no inaccurate information that can be misused. The negative impact cleaning data can cause would be that it is tweaking the “raw data.” Raw data is beneficial since you can make up anything from that and work on it. Cleaning data was used by the Police Department so the public could have accurate and updated information about crimes in St Louis.
While looking over these data sets, I was considering what the Police department’s goal was for publishing this data. I feel as if they made these data sets for the public to be aware of the increase or decrease of crimes happening in their nearby neighborhoods. They also published this because it can show how the Police in St Louis are helping in committing crimes. The department wanted to publish every year of crimes from 2021 to 2024 for the public to see the different amounts of crimes that were committed by civilians.
The way I would use this data to examine would be copying and pasting the data records and making it into a bar graph to see the increase and decrease of the crimes throughout the years. This data can help surrounding neighborhoods be aware of the crimes that are happening within their community. They could make a change in their community and help in making these crimes decrease. The community has to work together to flourish peacefully and have fewer crimes.
Evitt Nashed
April 10th, 2024
Our Final Lab for Codes 122 was a conducted survey that was sent out to the public and MOBOT researchers to get a more thorough understanding of our wicked problem. My group’s survey was about the lack of knowledge within the MOBOT about indigenous knowledge. We decided to ask a series of questions in our survey about indigenous knowledge in the MOBOT and what we would get as a result to help us resolve this wicked problem. We only got 7 responses to our survey, which was less than we thought but was better than nothing! The people who participated in our survey ranged from research and department leaders, to graduate students, scientists, and even librarians.
One of our questions was, “What does indigenous knowledge mean to you?” A couple of people responded with traditional and environmental knowledge used for their benefit. Another answer we got was Any specialized environmental knowledge from a local group. They also gave us examples like Indigenous folks, organic gardeners, and craftworkers. We also had two responses about Robin Wall Kimmerer’s work and book about correlations of “native” and “Western” taxonomies: even Sacajawea’s role in the Lewis and Clark Voyage of Discovery.
Another question in our survey was how we can implement indigenous knowledge into the gardens. We got good answers about implementing research they conducted in the Madagascar Program. Another way we can incorporate indigenous knowledge is through exhibits, and also continuing to incorporate this into Western scientific research from the garden. Mostly, all researchers claimed that indigenous knowledge should be implemented everywhere in the MOBOT.

One of our last questions was about how indigenous knowledge should be showcased. These survey takers thought that museum exhibits and signs in the garden were good examples of showcasing indigenous knowledge. Other examples could be tours or guest speakers talking about the use of indigenous knowledge. A linkage I found within all these answers for this specific question is that all of them preferred signage as a good way to spread the word about indigenous knowledge. Signage is the design or use of signs to get a message to the public.
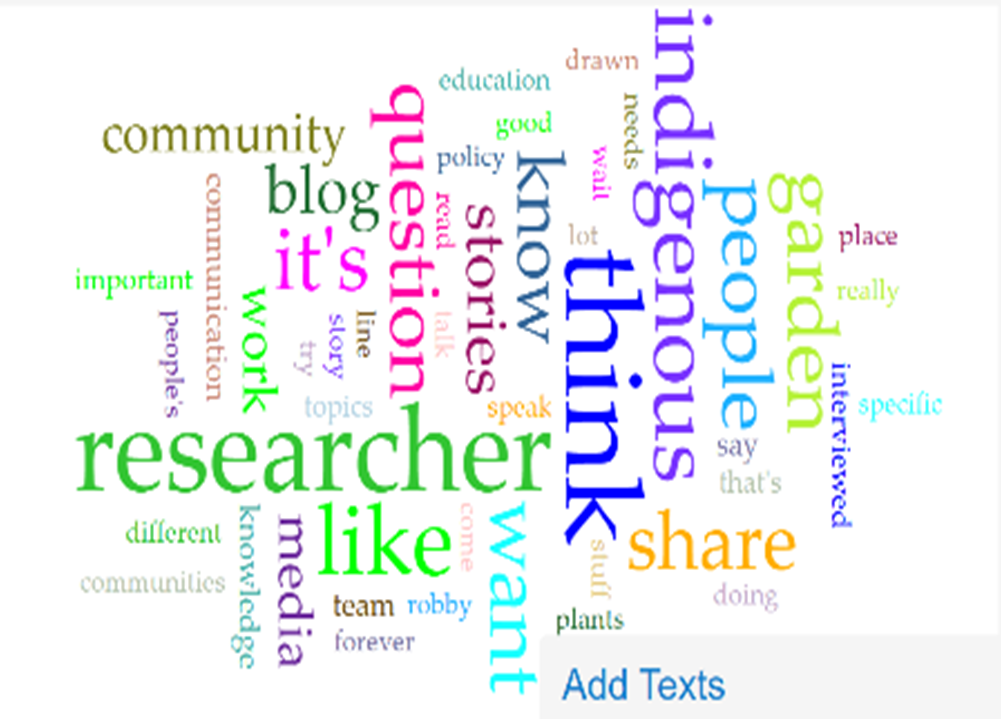
This survey overall helped us fill in the gaps and missing pieces of what we wanted to know about indigenous knowledge. Our surveys also helped to raise awareness about indigenous knowledge and why it should be implemented in the Gardens. Indigenous knowledge can give us insights into how these certain people lived and survived with only their natural resources. We can use this information to make MOBOT a less Westernized facility.
Even though we got good responses to our survey, MOBOT still has qualitative challenges and problems that are hard to fix. Libraries, databases, and archives can be one example of a challenge the garden faces where the knowledge is broad, but not deep. Another challenge is that it is difficult to get more detailed information from indigenous communities because meaningful and sustained community connections take much time to receive. Many indigenous people do not have the communication resources we have so it takes a good amount of time to get good information.
Evitt Nashed
Dr. Smith
March 25, 2024
After synthesizing and reading two articles about cleaning data, I feel as if cleaning the data is more ethical when doing research. I didn’t agree with the article, “Against Cleaning” because data cleaning can help you have better visualizations and useful data. The author talked about how Data cleaning can cause a messy outcome for their research. I honestly fully disagree with that. Being uncertain causes messes within the research. It’s good to review your data more than once and correct the errors.
An article I agreed with was the article about data visualizations. This article went into depth about the ways we can make uncertainty disappear. It gives us examples like refining the data you’ve made. The author’s main point in this article is to face ambiguity head-on through visual means. Another example to fix uncertainty would be plotting data with statistical, visual displays.
One way we can deal with complicated data is to show your workflow of how you are forming that data. That workflow can help make understanding data a lot easier. Another example of dealing with complicated data would be of course cleaning the data. I believe that not cleaning your data can cause a load of messy work and uncertainty. The last example I feel is important when dealing with complicated data is to keep the original data raw and to make a copy of it and work on that copy. It is important to keep your raw information so that other researchers can look back into that raw data.
To conclude, I agree with cleaning your data so that it is more efficient to look back on. Not cleaning your data can cause problems within the data which can make it a lot harder to work with. I can use this information in the future by always looking over my data visualizations and making sure it’s clean and makes sense.
Evitt Nashed
Dr. Smith
March 17, 2024
During my spatial analysis lab, I’ve made some clear observations of the areas and places around SIUE. I decided to look up different restaurants, fast food places, and gas stations in Edwardsville and see how long it would take to get there. At first, I didn’t understand the lab because I didn’t know the meaning and purpose of this lab but I soon realized what it was towards the end.
I first started by looking up gas stations near SIUE. The closest one near campus would be the Circle K gas station. To drive there, it would take about 5-7 mins depending on where on campus you’re at. Another place I looked at was fast food places. I looked at Sonic and saw it would take about 5-7 minutes also. Now if you’re riding a bike, that could differ. If you’re on a bike, it would take about 20 minutes. Another place I looked at was Walmart. To drive there it would take about 13 minutes. Walking to Walmart would be a different story though. That would take about an hour or even longer to get to Walmart if you’re walking.
The point of this lab was to realize that locations of places can affect certain people. For example, there are lots of students that don’t have cars on campus. They have to resort to either walking or taking the bus. This can be a big problem for them because they could be in a hurry to get something, but they will have to wait till the right bus comes to pick them up. Locations of places affect these kinds of people who don’t have cars because they have to work around the town’s transportation.
Evitt Nashed
Dr. Smith
March 13, 2024
Ethnography is defined as the customs and personalities a certain group shares. For my ethnography observation, I had to observe people in the Lower MUC at SIUE. My tasks involved watching these kinds of people talk, what they are doing, what topics they are talking about, etc. As I was observing I formed the main question, “Are you at the MUC to socialize, eat, or work?”
I started my observation at 2:00 because that’s when the MUC was busy. I sat where the Cocina and Pizza place were at. The surroundings of my place were full of tables and seats. There are also TVs present for people to watch. I counted how many people were around me and made an average of about 30-40 people. While observing, a couple groups of people were together eating and socializing. None of them had any textbooks or homework, so I wouldn’t assume they were working on something. There were a couple of students just sitting alone either on their phones or being productive with work.
The overall surroundings of this area were loud and didn’t have any quiet places. The observation I’ve made through watching these certain people was that the MUC is a common place for people to mostly socialize with others and not a place for quiet time or work. I felt as if this was going to be the answer since I don’t go to the MUC to work, instead, I go there to socialize with my friends and talk about our day or random drama.