The data set I wanted to look at was through the Department of Environmental Health Services about animal bites in St. Louis. Their data collection fails to clarify why they selected to establish this file for animal bites. The data has been sorted and divided into numerous groups, including animal species, wards, home number, neighborhood number, and more. When I examined the statistics, I observed that even though the headline is “animal bites,” it refers to mostly dogs and not many other animals. The only other animals there are cats and wildlife, who are in the minority. This raises a few problems, starting with precisely why dogs garner more attention than cats.
The data set’s origins lie in the Department of Health’s efforts to maintain public health and safety by tracking incidents of animal bites. The reports collected by the Department serve as the primary source of data, reflecting the actual occurrences of bites reported within the city. This data is crucial for identifying trends, assessing risks, and implementing targeted interventions to prevent future incidents.
In this data, there is a possibility of some animal bites coming from the same dog or cat in the same neighborhood or ward. An important thing to note however is that some areas don’t have a house number. That makes it hard to establish data in those areas. It could mean that there is a vacant house, an empty lot, or several other possibilities. When this issue arises, there is a blank on the CSV data set.
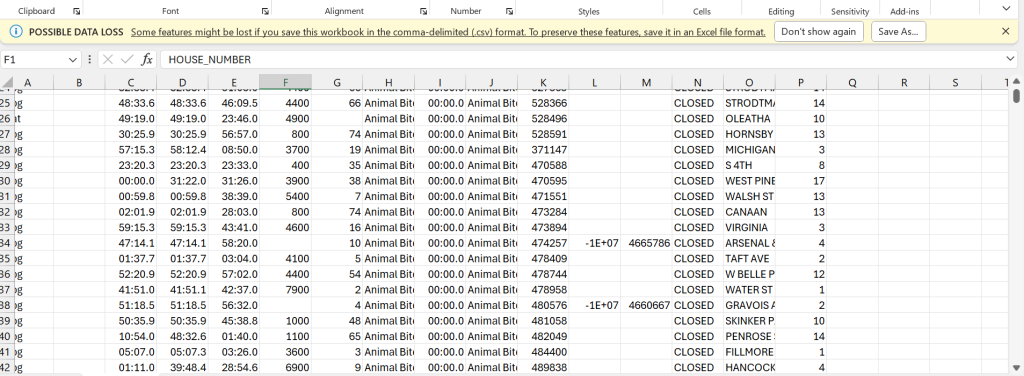
In this picture there is an example of a row without a house number on this excel sheet.
The “Animal Bites” data set has various potential uses, such as analyzing trends over time, identifying high-risk areas, and evaluating the effectiveness of animal control measures. However, there are challenges associated with using this data. For example, reporting biases could skew the data towards certain types of animal bites or areas with higher reporting rates. Additionally, inconsistencies in how bites are reported or categorized could affect the accuracy of any analysis based on the data.
The “Animal Bites” data set offers valuable insights into the dynamics of MOBOT (Missouri Botanical Garden) and its surrounding communities. Analysis of this data can reveal patterns in animal bites, highlighting potential risks to residents and visitors. By identifying these patterns, authorities can implement targeted public health campaigns and animal control measures to reduce the incidence of bites and enhance overall safety. Additionally, understanding the types of animals involved and their locations can promote community engagement and awareness. For instance, areas with high bite rates could prompt collaborative efforts to address issues like stray animal populations or inadequate pet care, fostering a safer environment for everyone.
Moreover, the data can inform policy decisions regarding animal control and public health in the vicinity of MOBOT. Insights from the data could lead to the implementation of policies that regulate pet ownership or improve animal control measures, mitigating risks associated with animal bites. Furthermore, researchers and educators can leverage this data to study the factors contributing to animal bites and develop educational programs to prevent them. This approach could be particularly beneficial for schools and community organizations in the surrounding areas, contributing to a safer and more informed community overall.