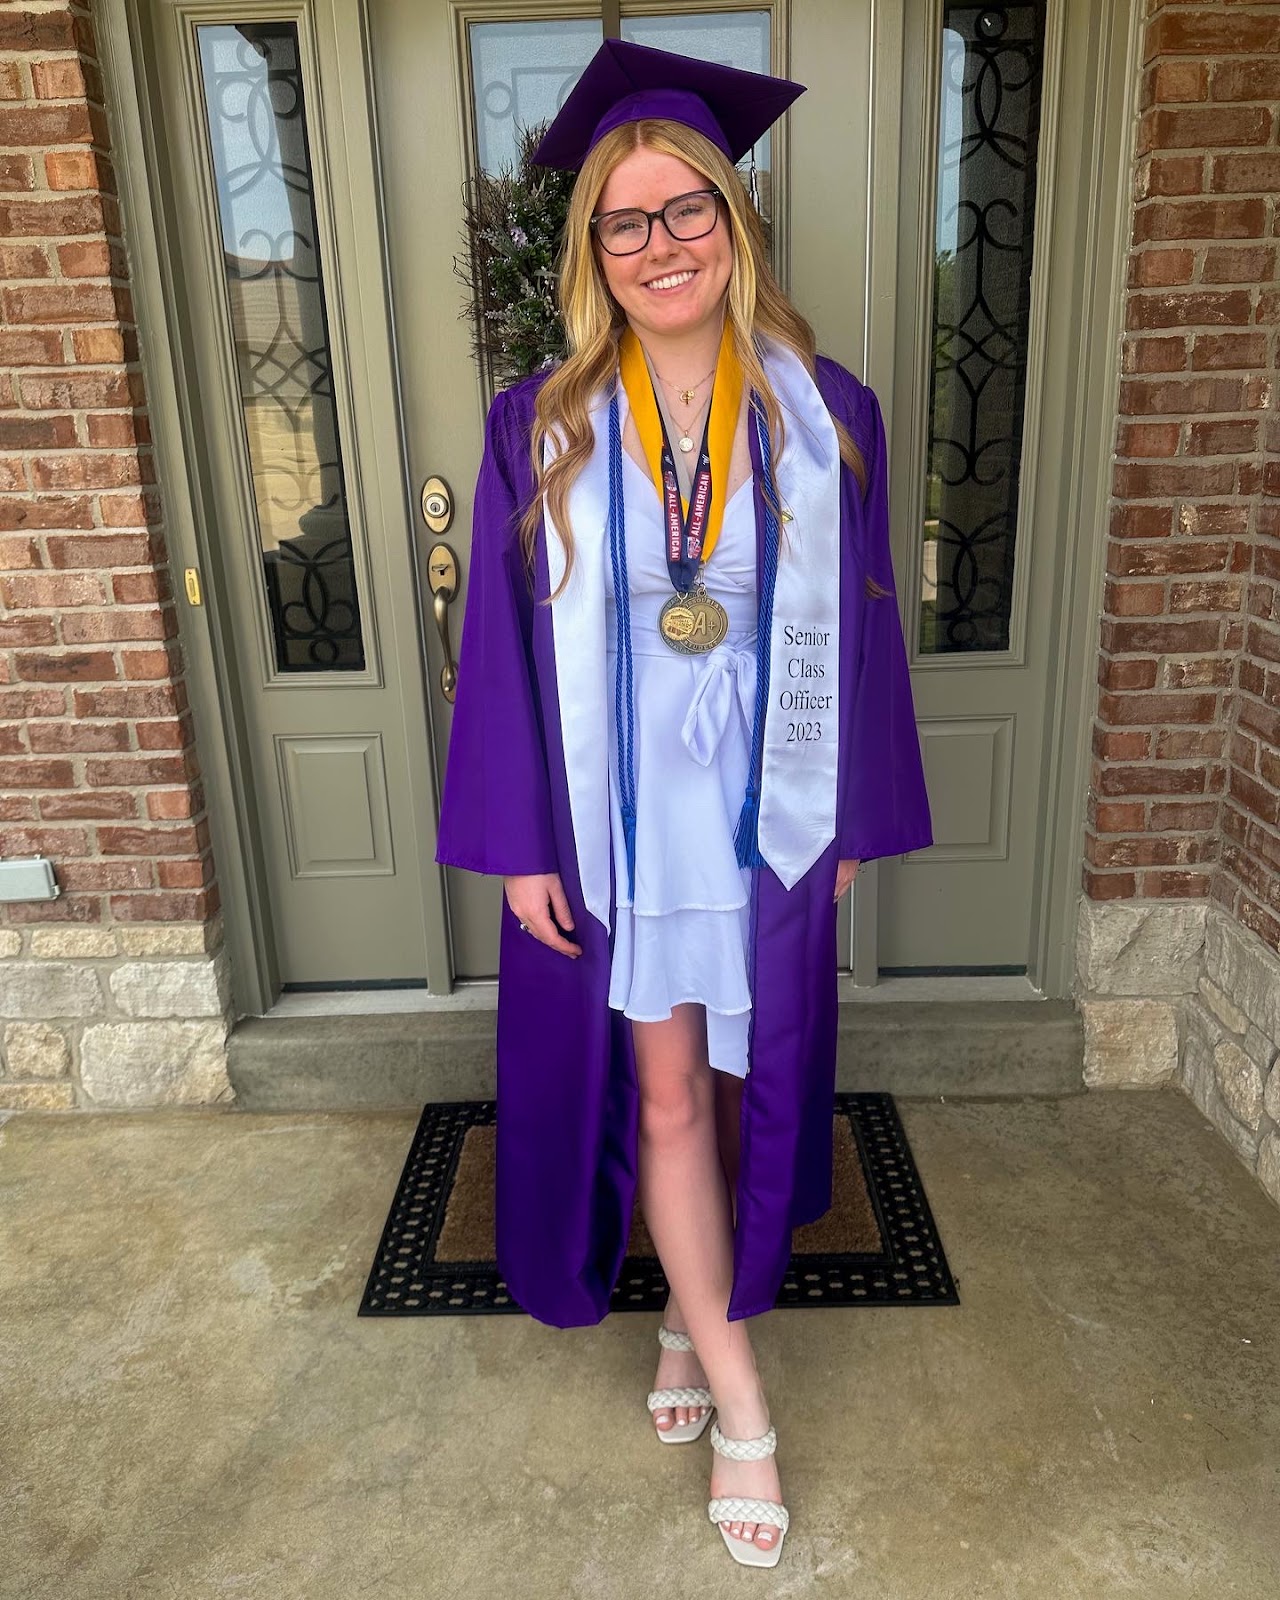
In this section, I will share the jobs, extracurricular activities, and research experiences I have been involved in throughout my undergraduate journey. Each of these experiences has helped me grow personally and professionally while developing skills such as communication, leadership, teamwork, organization, and critical thinking. They have also given me opportunities to explore my interests, step outside of the classroom, and prepare for my future career in speech-language pathology.
We had our first visit of this school year to the Missouri Botanical Gardens. We learned a lot of useful information from their interpretation team about the different media and approaches they have in place for spreading information about the garden. We learned about the different types of media; QR codes that lead to websites, pamphlets, educational videos, hands on activities, and signage within the garden. As CODES students, we can use this information when thinking about how we want to implement our research from the past year into the garden.
Our time with the interpretation team was helpful. We were informed on most of the ways that the garden shares their information with the general public. We came up with pros and cons for each method. It had the groups thinking about the best methods to demonstrate our research topics. We found that signage is a selective approach that typically only appeals to individuals who like to read, QR codes appeal to younger audiences who are usually more willing to scan them, and educational videos tend to appeal to educators. While all of these approaches are appealing to specific audiences, we need to figure out a way to appeal to all individuals, no matter their age. It will probably be a challenge when trying to appeal to all ages. Whether it be children, teenagers, adults, or senior citizens, we need to make sure the information we are sharing can be understood and easily accessed by everyone.
Last week when my group met for class, we decided on three ways we wanted to share our information. Our first idea was to have a QR code for a virtual tour in the garden. The QR codes could be on the signage, and if the visitor wanted to learn more about the history of the plant, they could scan the code and find out more information. After visiting the garden, I do not think this is my favorite idea. I feel like it is selective because it will only spark the interest of people who choose to scan the code, and again it doesn’t really appeal to all age groups. Our second idea was to have a specific tour offered for indigenous plants. It would be a guided tour that was led by someone trained on Indigenous knowledge. However, this also will only spark the interest of people who are wanting to learn more about this. Most individuals probably do not know Indigenous knowledge is even incorporated at the garden, so this is also selective. Our third idea is to have a specific exhibit on Indigenous knowledge. It would be an interactive exhibit offered to learn more about the history of how Indigenous knowledge has impacted the garden.
Even with all of these good ideas for our implementation plan, not one of them is a perfect solution. Our group was talking during class and we came up with a solution that we could combine all three of our ideas. It would allow our knowledge to be adapted to all age groups and interests. By doing something interactive in the exhibit, it would appeal to younger audiences, having a QR code that leads to an online resource can appeal to teenagers and young adults, and having an in-person guide telling the stories of the garden could appeal to the older population of visitors.
All in all, our most recent garden visit was very informative. We learned the different methods of how they share their information with the garden visitors. However, I think it would be important for each group to have someone who works at the garden be our mentors. It would be a good resource when we have questions or when we need to be connected to somewhere else in the garden. My only complaint about our meeting was that I wish we could’ve already been assigned our mentors and met with them. Other than that aspect, our visit was very informative to begin our implementation.
I chose the data set Planned Plantings- City Trees (Planting Sites). I could not find the creator or contributors of the data set. The department is called Forestry It demonstrates mapped planting sites that have been inspected for planting pending funds from the Aldermanic Ward Funds. It helps allow them to organize the data about the planting sites in order to evenly disperse the funds. It allows them to be able to see the requests in chronological order, to make sure the older planting requests are not being overlooked. Each ward gets their planting requests first, but if there are extra funds, they will be used in places not requested in order to plant more trees for the community.
The data is structured in 10 different categories. From left to right they are; address, city tree guid, current condition of site, date inspected, IS request, location, location type, on {road}, request ID, and ward number. They way the organized the data has allowed them to use it effectively. They need to know the dates of requests in order to make sure older ones are not being overlooked. It can also give the workers insight on the condition of the site they will be planting on. It helps the workers tremendously by allowing them to easily access the information. They can have all the data on one spreadsheet. They can find the location, and location type in order to figure out how to do their best work.
I can not find any information on the creators of this datasheet. However, I have learned that it is important to do at least some kind of cleaning when it comes to data. You need to make sure your spelling, and organizational skills are superb. If they did not choose to clean the data. It could have been hard for a viewer to understand what was going on. Additionally, too much data cleaning can result in leaving too much crucial information out of the data, leaving the viewer confused.
The creators are concerned with tree planting in and around the St. Louis region. Since they are well informed on the topic, they know the information they needed to add to make this data sheet make sense for their work. The creators goals and identities involved in creating the data set could have shaped the data intentionally and inadvertently. As mentioned prior, they know the information they need to do their work, but they also may not be aware of the information that the public wants out of this data sheet. For example, cost is not listed in the data sheet, neither is the reason for choosing these specific areas. The public could use this data in order to see how their community is expanding within tree plantings. It can show them that there are people doing work to better their community.
This data can help us understand the complex dynamic of the Missouri Botanical Gardens and all of the surrounding communities because it gives a good example of organization skills. It shows records of when things were done and gives a description of the area in which these things are taking place. We can use this when working with MOBOT because it shows us how important it is to give descriptions with things. In our case, it can show us the importance of showing the hidden knowledge that is all around the garden.
Our field trip to the Missouri Botanical Garden Archive was very informative. We learned so much new information about plant cataloging, and gained a better understanding as to what goes on behind the scenes at the garden. The documents were different than I had imagined. They are on normal pieces of paper and the plants are held on to the paper using tape, glue and even dental floss. Additionally, most, if not all, have barcodes on them which may lead the viewer to the tropicos database. Each plant contains a text that may include different things. For example, it can give a description or not depending on who found the species, and additionally the area, family, genes, and locality. The catalogs are not comprehensive, they are simply snapshots of that specific time according to that botanist. If that botanist chooses to have a description with their plant, they may interview a local to figure out the uses and other details about the plant. However, this can show biases because they only show one point of view of the interviewee. This means that the overall voices of the culture may be silenced. This results in the botanist having the loudest voices within the catalogs because they have the total freedom and power to pick and choose details that they think need to be with the plant. We can relate this information to our research team because the cultures involve some indigenous knowledge (or lack thereof). We can use these catalogs as building blocks in order to fill in gaps with future information. With all the information we learned during our visit, I believe that in order to fill in the culture aspect of the plants, the botanists need to interview multiple different people within the culture, in order to represent it respectively and fully. In conclusion, our time at MOBOT was very helpful and informative in relation to our theme within our research team.
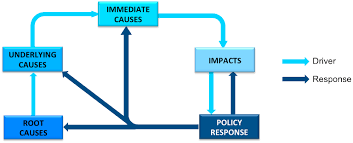
According to chapter three in Sustainable World, written by Sonya Remington-Doucette, a causal chain analysis is “a tool for analyzing socioecological systems by classifying key drivers, establishing the relationships among drivers, and determining their relative influences on a system.” (Remington-Doucette, 123). A causal chain analysis is needed to identify indicators relating to sustainability, link our problem to the drivers that are causing our problem and the extent of them, and to see how human interaction is affecting our problem. Causal chain analysis can be made in different ways. As graphs, charts, or even simply listing them out. Below is a graph example of a causal chain analysis.
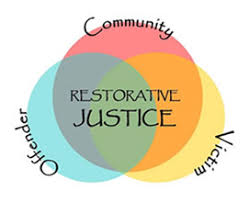
To understand our causal chain analysis, we need to identify our problem: Reparative Justice. According to the New England Board of Higher Education, “reparative justice is a way of thinking about justice (a mindset) that centers those who have been harmed, and focuses on repairing past harms, stopping present harm, and preventing the reproduction of harm.” (NEBHE). Within our CODES cohort, we are working with the Missouri Botanical Gardens in order to help emphasize biodiversity within their plant conservation. There are many different problems within the herbarium and their plant catalogs. This is an issue that needs to be stopped right away in order to prevent our future generations from being hurt. Furthermore, it needs to be helped in order for the problem to not repeat itself. As you will see below, there is a chart demonstrating how community, victims, and offenders all tie in together to our theme of reparative/restorative justice.
The Factors that are Relating to Reparative Justice
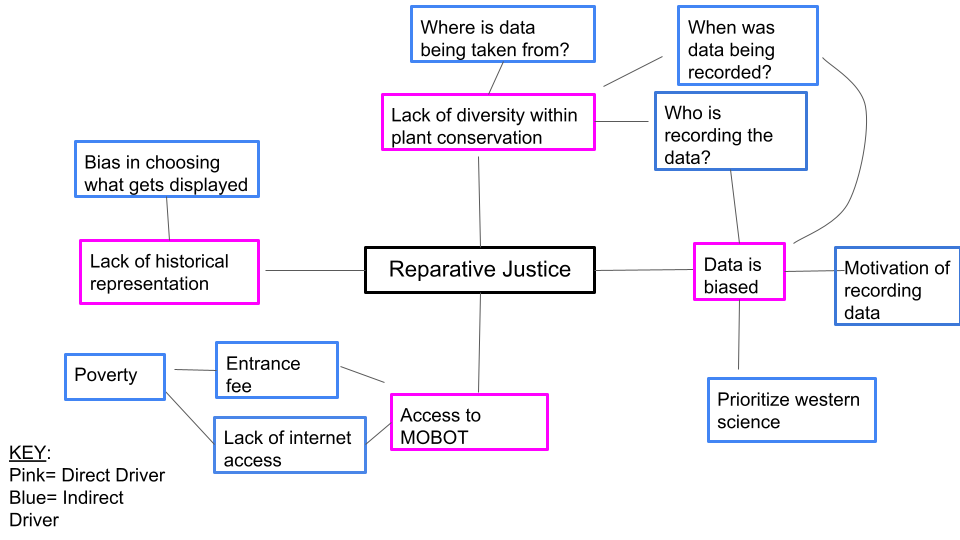
“Causal chain analysis promotes deeper understanding of sustainability problems by connecting drivers to the problem.” (Remington-Doucette pg. 147) In order to solve any wicked problem, it is very important to know the direct and indirect drivers of a problem. Direct drivers are things/people that have a direct influence on an issue. Indirect drivers are the things/people that are not directly causing a problem, but they are problems that are learning into the direct drivers. In our case of reparative justice, we need to understand our drivers.
Direct and Indirect Drivers Chart Created By Me
Within the chart above, I have identified a few of the possible drivers of our problem. One driver in reparative justice is the lack of historical representation. This can be caused by having bias in choosing what gets displayed at the gardens and online. It can be influenced by the people or group of people who are responsible for this aspect of the Missouri Botanical Gardens. Our second driver is the lack of diversity within the plant conservation. This is affected by several indirect drivers. For example, where the data is being taken, when the data was recorded, and who recorded the data. A third direct driver could be a bias in our data. Nowadays, plant conservationists and researchers tend to prioritize western science. Additionally, bias can be affected by the motivation of the person recording the data, who is collecting the data, and when. A final direct driver could be the access to the Missouri Botanical Gardens. However a person decides to view the gardens, whether that be online or in person, it costs money. Entry tickets for the gardens are roughly around $14 depending on the day/time a person plans to visit. Furthermore, if someone wants to access the garden online, they have to have access to the internet (which also costs money).
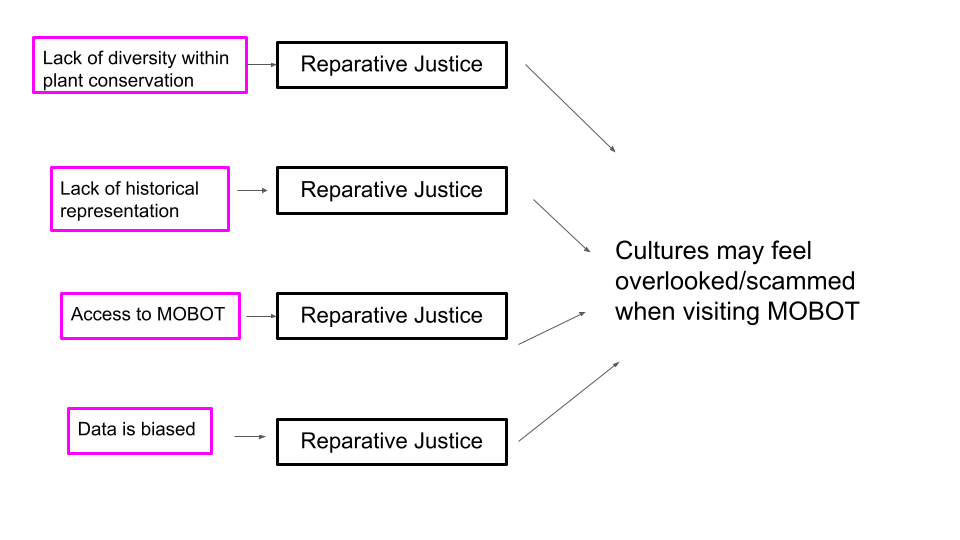
Causal Chain Analysis Created by Me
As you may see, I took the direct drivers from my first chart, in order to create my causal chain analysis. Even though I chose the main problem as being “cultures may feel overlooked/scammed when visiting the Missouri Botanical Gardens”, there are many different problems an individual may choose based on reparative justice. Reparative justice is a broad term, especially dealing with the gardens because there are many different reasons reparative justice needs to be fixed. Such as healing the individuals/cultures that have been influenced, displaying proper biodiversity within the gardens, and to stop future generations from being hurt by the lack of cultural representation.
In conclusion, according to Sustainable World, written by Sonya Remington-Doucette, a causal chain analysis is “a tool for analyzing socioecological systems by classifying key drivers, establishing the relationships among drivers, and determining their relative influences on a system.” (Remington-Doucette pg 123). A causal chain analysis is very important for individuals who are trying to solve a wicked problem. In our case, we need to act promptly and knowledgeably in order to help restorative justice at the Missouri Botanical Gardens.
Sources:
S
“Reparative Justice.” New England Board of Higher Education, https://nebhe.org/reparative-justice/. Accessed 12 Oct. 2023.CloseDeleteEdit
Here are the ways that I want to achieve an A in CODE120 and how I will achieve them.
1A: demonstrates ability and commitment to collaboratively work across and within community contacts and structures. (15%)
In my opinion, this means that I need to be able to work well with others while helping to improve the community, yet still keeping order and design of a project. I will demonstrate this by taking notes on how well I work with others and how I contribute in the group setting.
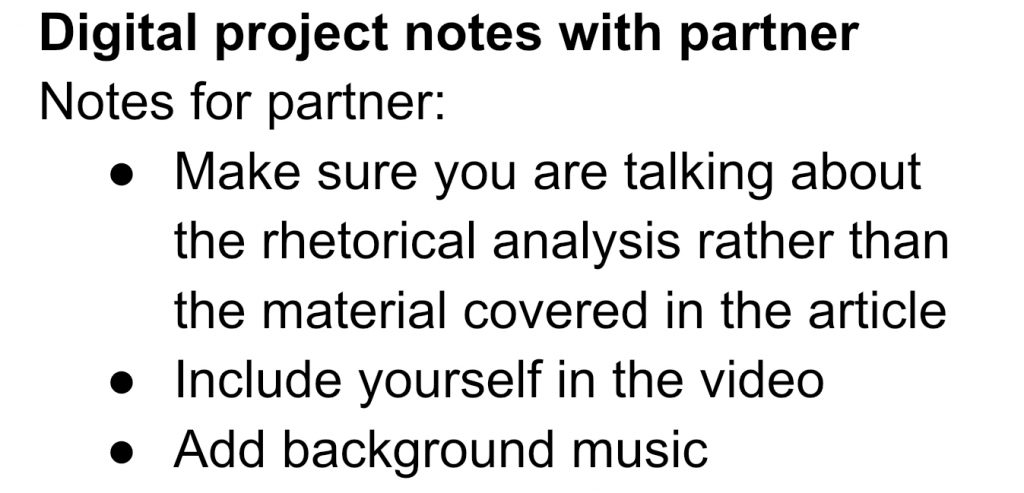
I have demonstrated this by helping my partner improve on their rhetorical analysis for out digital project 2. 2B: takes risks and approaches to learning to create new knowledge. (15%)
In other words, this means that I will use my risks and failures to grow. I will demonstrate this by recording my failures, or when I take new risks. For example, if I try a new writing style or a new research method in my reflections, digital projects, or during in class discussions.
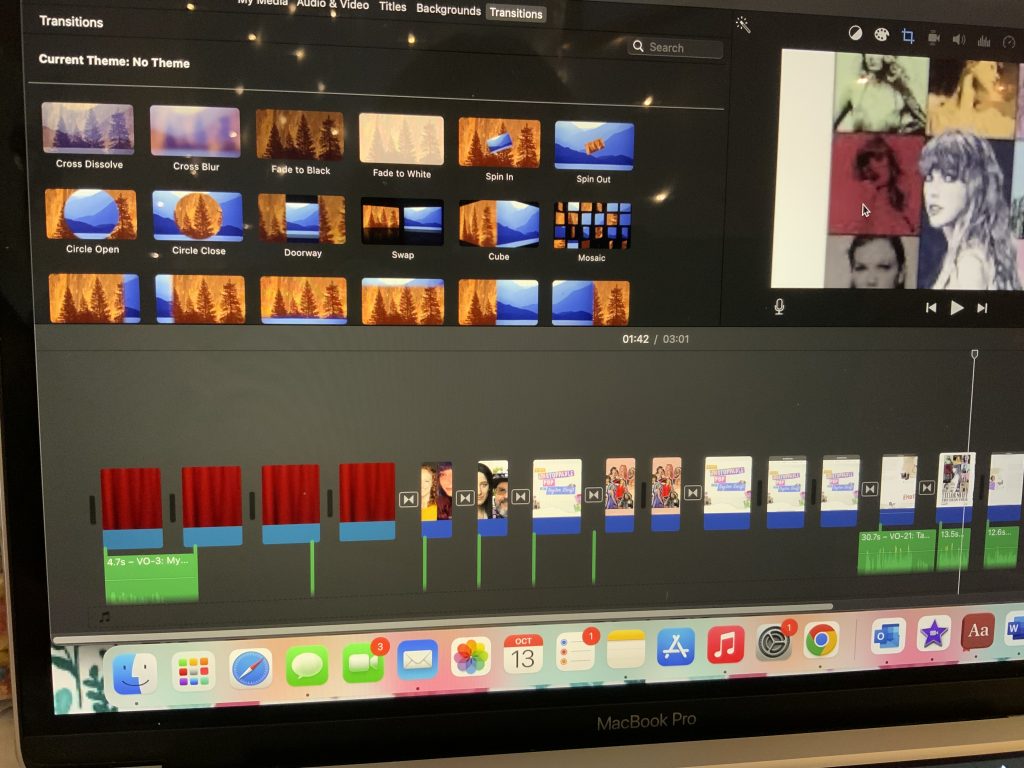
I feel as though I leaned a lot using iMovie. It was new to me, so I had to watch videos in order to learn how to use it. I used iMovie to make the digital project video. 8C: develops clear, innovative central messages with significant supporting materials. (20%)
In my words, this means that I will need to be able to deliver the theme of a story/article by using evidence. I will demonstrate this by always citing my sources and trying to summarize better through my reflections.
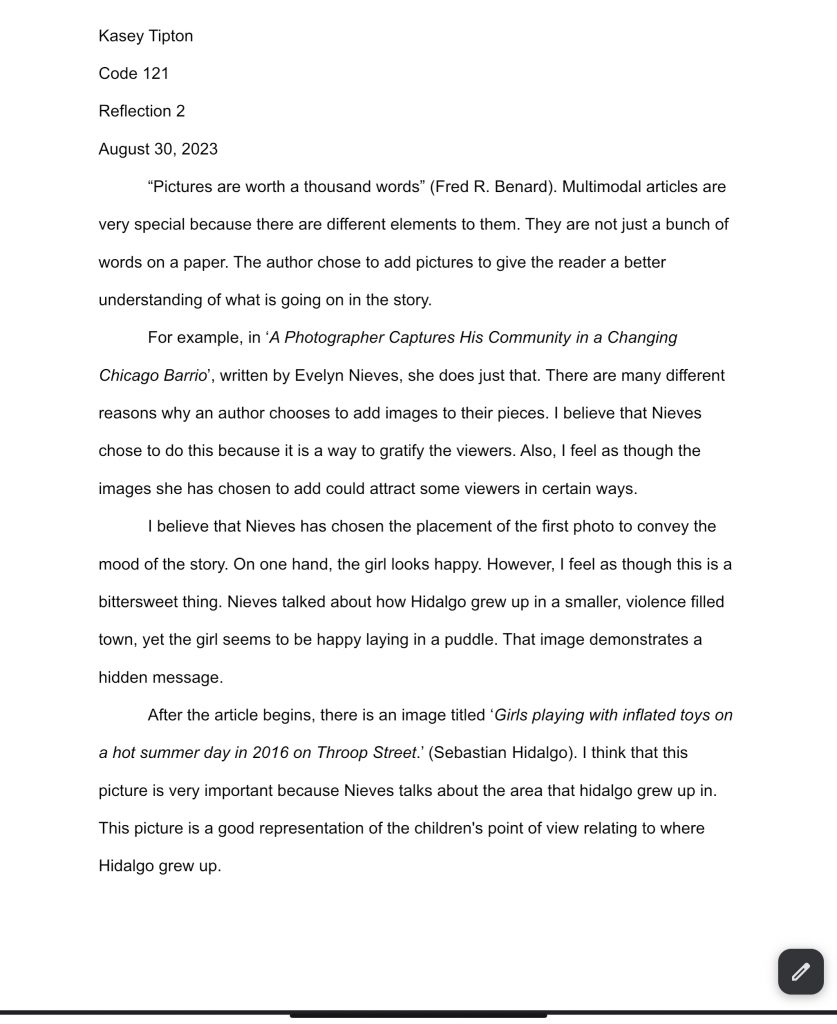
I believe I have demonstrated this throughout my reflections. Here is an example in reflection 2. I believe that my writing clearly defines the central theme. 11A: evaluates texts, scholarly significance to apply reading to other contacts or issues. (30%)
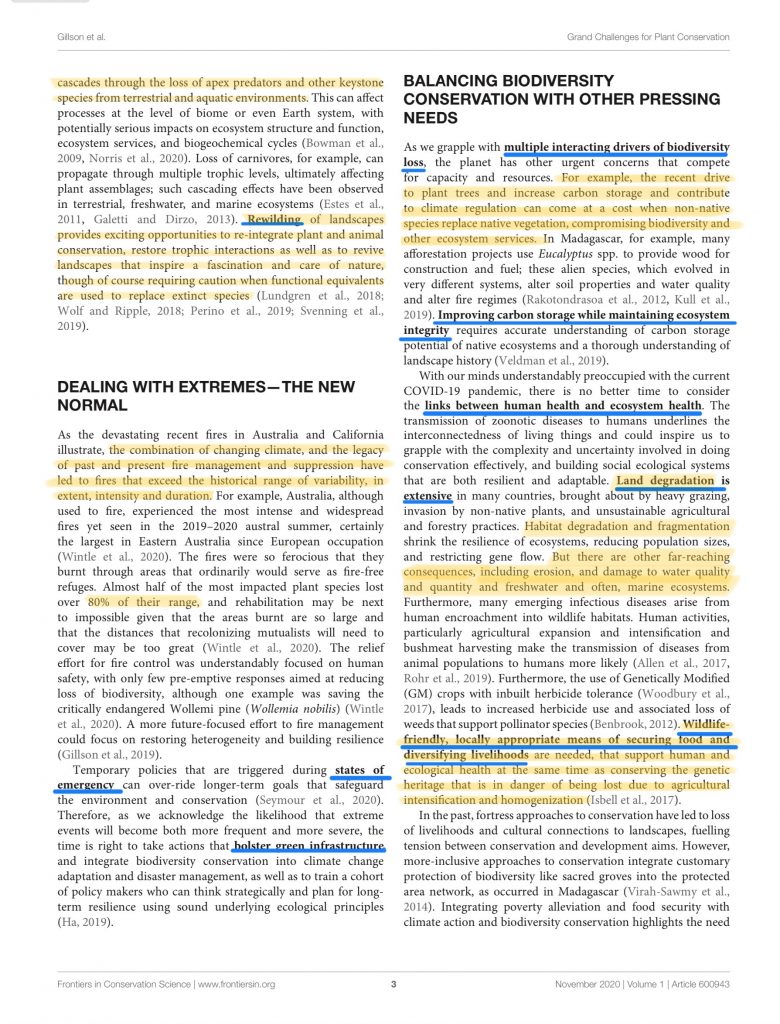
This means that I will be able to annotate and relate a text, or article to previous knowledge. I will demonstrate this by showing my annotations, and showing how I connect them to real world situations through my reflections. Also, through my annotations of our readings.
13C: uses language to skillfully communicate with clarity and fluency (20%)
In my words, this means that I will be able to use correct grammar, and techniques to inform others. To demonstrate this, I will submit different writings that I produce to show correct grammar, and fluency. I will show this through my reflections and digital projects.
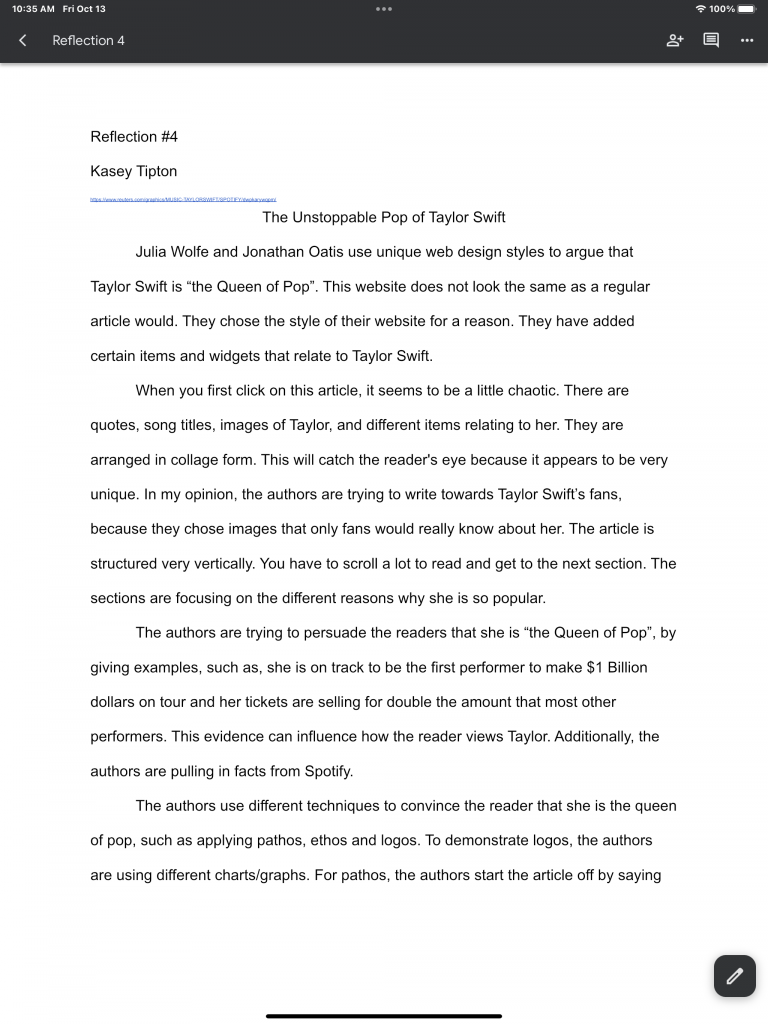
I believe throughout all of my reflections I have use correct grammar and writing techniques. This is reflection for, but I believe I have demonstrated this throughout 1-5. Sincerely,
It was July 19th, 2016. The day had finally come. We had spent the last several weeks packing up our things. I remember looking around my empty house for one last time, remembering all of the good and bad memories that have happened here. I wouldn’t have traded it for anything.
I had lived all of my life, from the time I was born to 11 years old, in Kingsport Tennessee. It was my home. The only place I’d ever known. My parents, grandparents, great grandparents, etc… are all from Tennessee. My parents and sister were born in Maryville, Tennessee. However, when my sister was five, they moved to Kingsport because my dad got a new job. Three years later, I was born. My mom always had her kids in her best intrust, so I started early in life going to preschool. My mom was a teacher’s assistant, so she was there with me. I started preschool when I was about 18 months old and went until I was five.
After preschool, I started elementary school. I was so excited. I remember a lot of things about it. Gym class, field days, talent shows, and making new friends. I felt so lucky to have all my friends from preschool with me, and was excited to make even more friends. I’m grateful for all of the amazing different things I experienced. During elementary school, I learned I like to do math. I think math is an important skill to learn, and it has always come relatively easy to me. I always thought I would go to college to become a math teacher.
During my 5th grade year, I always liked to put on a show for others, so I tried out for the talent show and I received a spot. I was so excited to start middle school. I would be going to the same school that my sister went to, and always wanted to be just like her. I tried out for the cheerleading team, and I made it! I was so ecstatic. A few days after making the team, I went back to the school to get my bag, my pom poms, and my bows. I was so thankful and happy that I made the team. I felt like I had won the lottery. I was excited about all these new things I accomplished. After we went to the school, my mom drove us back home. My sister wasn’t home at the time and my dad was on his way home from work.
When he got home, I was so excited to show him everything I got from the cheerleading program. He told me he had something important to talk to me about. I remember immediately getting a pit in my stomach. Did I do something wrong? Did something happen to someone in my family? He started to explain to me that he had received a new job offer from a new grocery store chain in St. Louis, Missouri. “It would be a better opportunity for us and our family. I would be able to spend more time at home with you and your sister” he sad. I was in shock. My whole life had been flipped upside down. “Does Kayla already know?” I asked. He said “I had told her earlier.” He then told me we had to get in the car and drive an hour to go tell my grandparents the news. My mom and dad said it would be better to tell them in person. I cried the whole way there. My grandparents were shocked. They already didn’t like that we were an hour’s drive away, but in a few short months we would be almost eight hours away. I remember trying to get my grandma to stop crying by repeatedly saying “Hey, I made the talent show!” I didn’t like to see her cry. We were going to be moving in July, so we still had a few months to spend together.
St. Louis Arch
Going to middle school was a culture shock. I came from a school with about 200 kids and was thrown into a school with almost 1500 kids. The first couple of days I struggled to make friends. I was scared, shy, and felt alone. I knew it would all get better though, it just would take some time. After being in school for a few weeks I started to make new friends. Things ended up working out for the better. I missed cheer sign ups in sixth grade, but I was on the middle school team in seventh and eighth grade. I had learned that all you really need is yourself. I feel as though moving made me grow up faster in some way.
By the time I started high school, my parents had bought a cabin in Gatlinburg, Tennessee, so we could have a place to stay when we visit our family. It felt nice to have a place back near “home”. I started to become more interested in our family history. I learned that my great great grandfather and his family had lived in an old log cabin. It was located in the Smoky Mountains. When my great great grandfather was 12 years old, the National Park bought the house they lived in, along with the land. The house/barn is now labeled as “The Tipton Place”. It is so interesting to know that my family name and my family history is portrayed in a national park.
I always shared this fact with my history teachers throughout high school. They always think it is so interesting because most of the teachers have actually visited the Great Smoky Mountains National Parks. High school was such a fun time, and I loved it so much. However, it was hard watching all of my friends from Tennessee do different things without me. Seeing their homecomings, proms, and football games was hard. However, the hardest thing was not walking across the stage at graduation with them.
Being from Tennessee is something I am extremely proud of. I love having a unique background. Also, I love being from a state that’s full of nature, kind people, and diverse communities. I love being able to call Tennessee my first home.